clusterprofiler GSEA结果网络图
简介
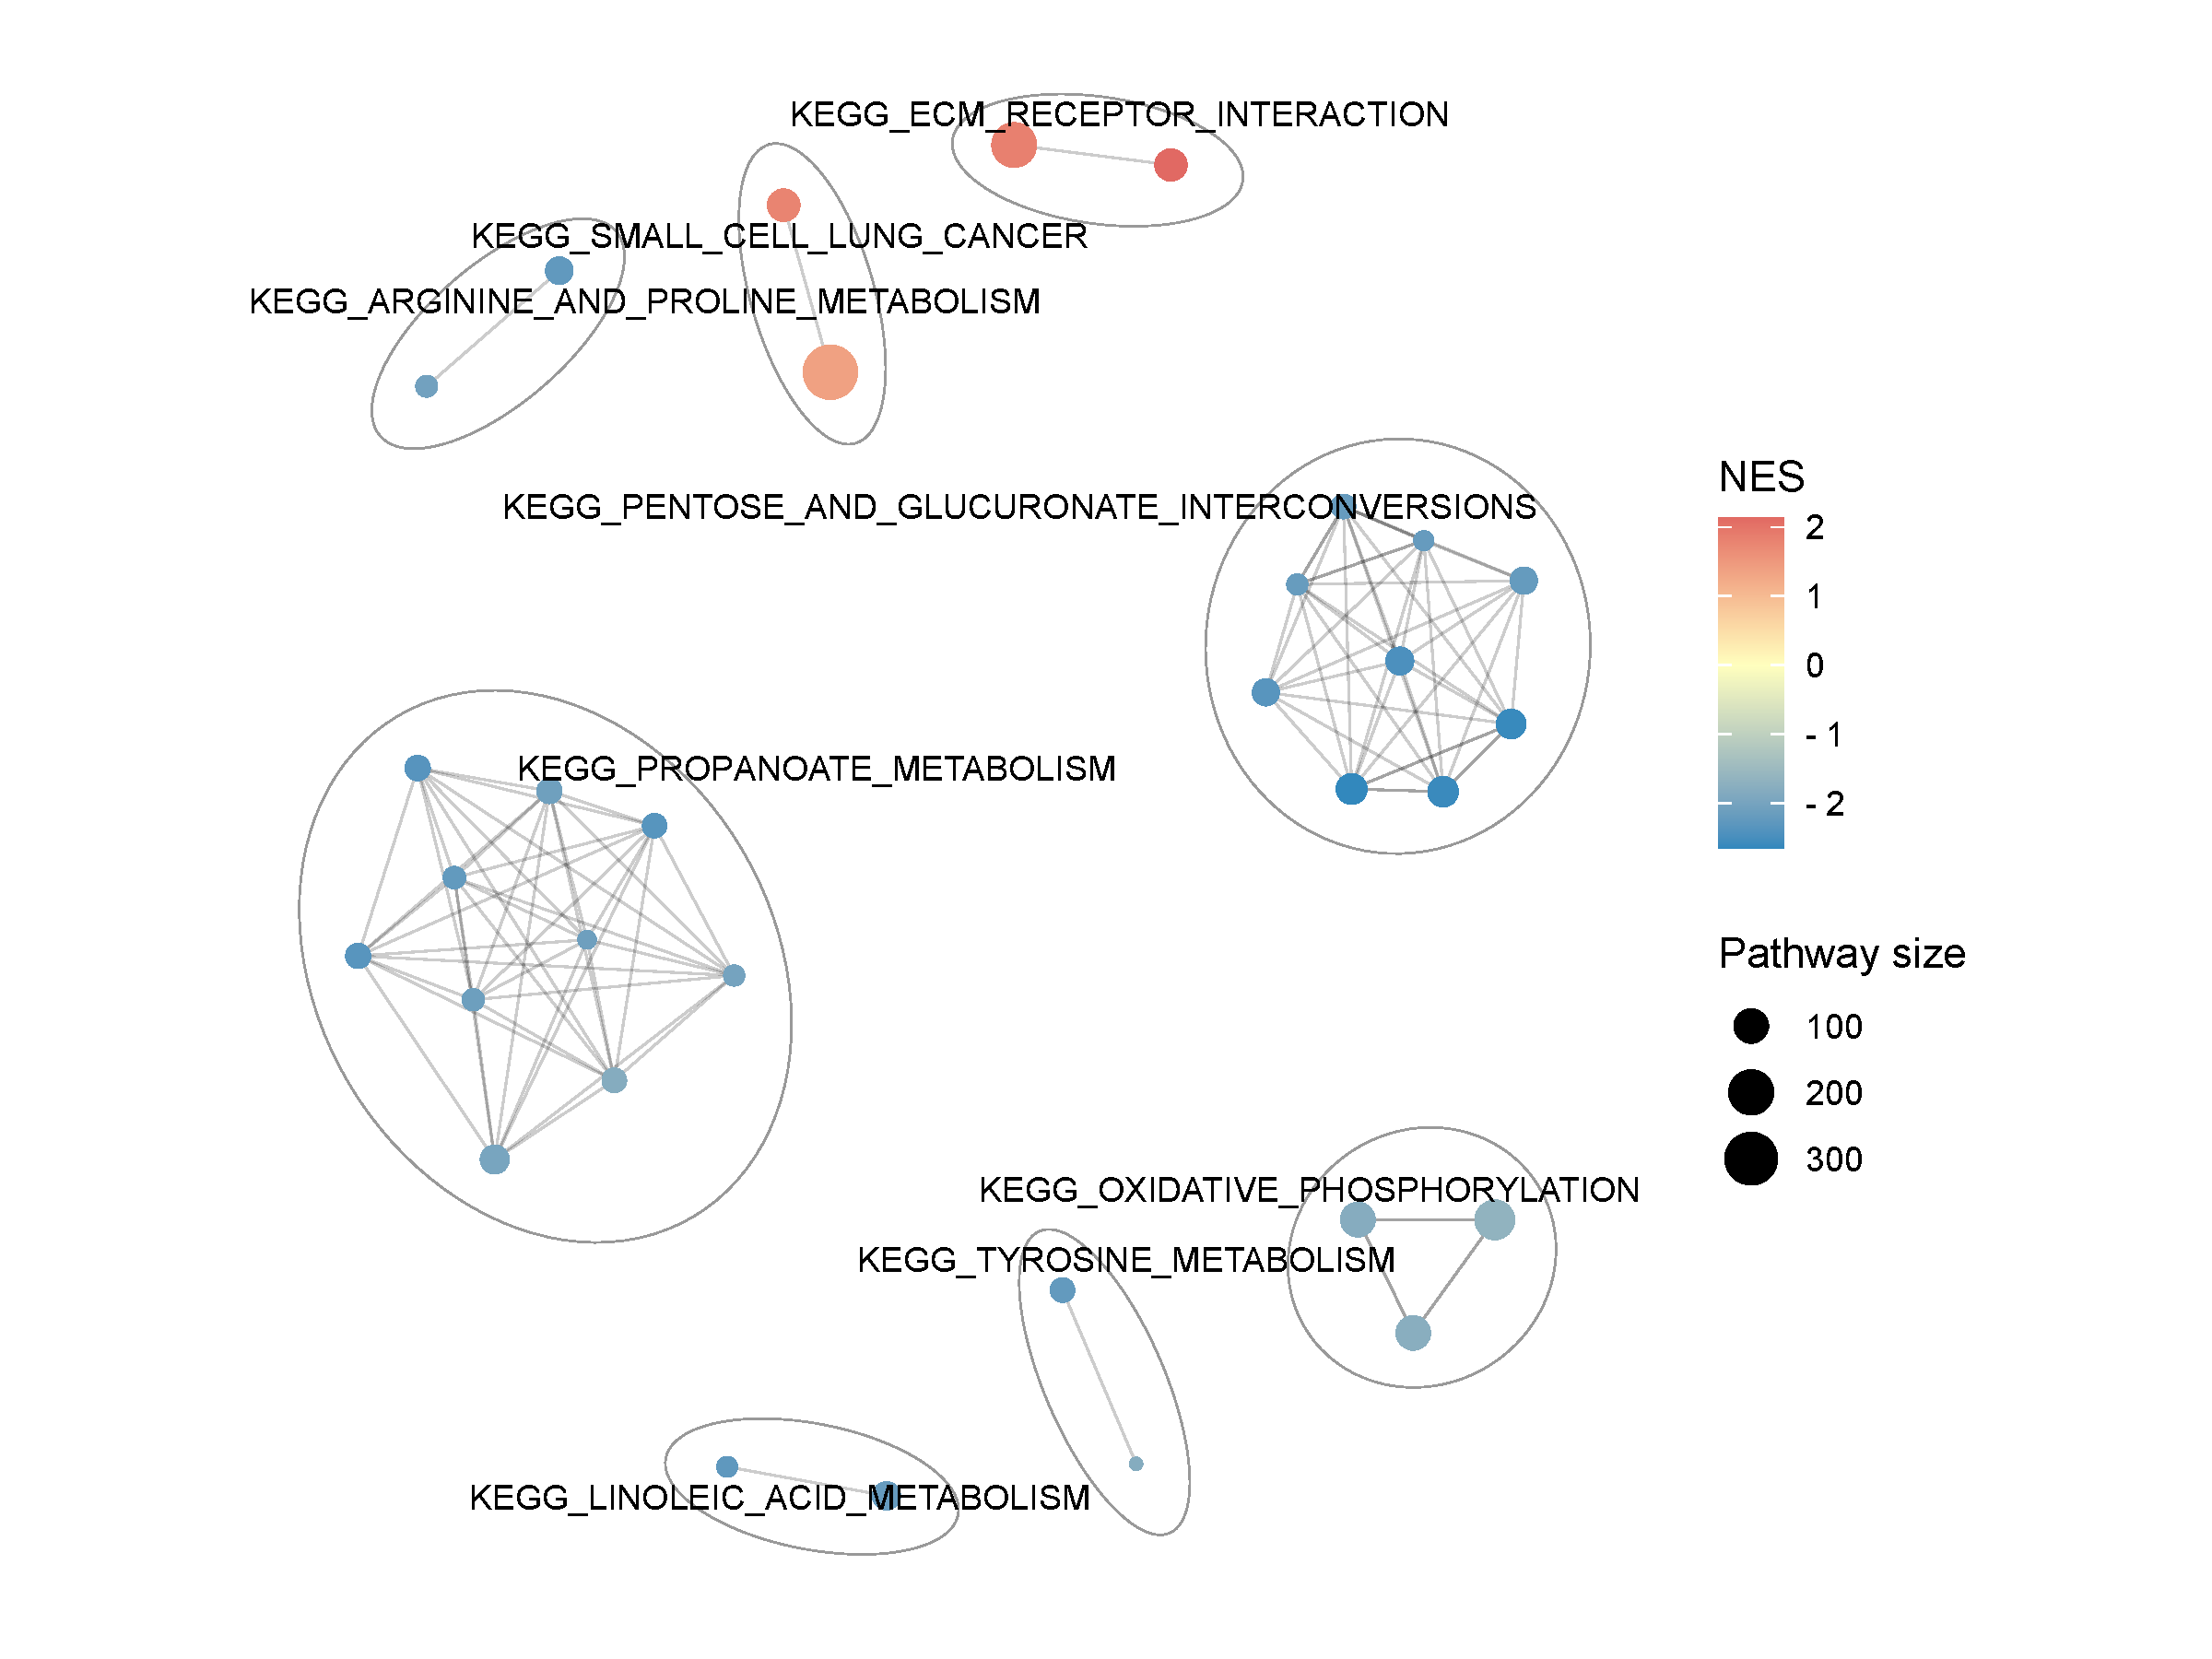
输入clusterProfiler包的
GSEA结果,根据不同基因集间的相似性,将N个基因集聚类成几个基因集,并用网络图呈现。调用aPEAR包。
数据说明
输入数据为clusterprofiler输出的rda(R对象)文件,可使用
clusterprofiler GSEA进行分析后获得rds文件。输出为聚类网络图,和纳入的基因集所属的cluster。
论文例子
aPEAR: an R package for autonomous visualisation of pathway enrichment networks
如何引用?
建议直接写网址。助力10000+篇
(google学术),9000+篇
(知网)论文
正式引用:Tang D, Chen M, Huang X, Zhang G, Zeng L, Zhang G, Wu S, Wang Y.
SRplot: A free online platform for data visualization and graphing. PLoS One. 2023 Nov 9;18(11):e0294236. doi: 10.1371/journal.pone.0294236. PMID: 37943830.
方法章节:Heatmap was plotted by https://www.bioinformatics.com.cn (last accessed on May 4, 2026), an online platform for data analysis and visualization.
致谢章节:We thank Mingjie Chen (Shanghai NewCore Biotechnology Co., Ltd.) for providing data analysis and visualization support.