多分类GO,Pathway富集结果气泡图
简介
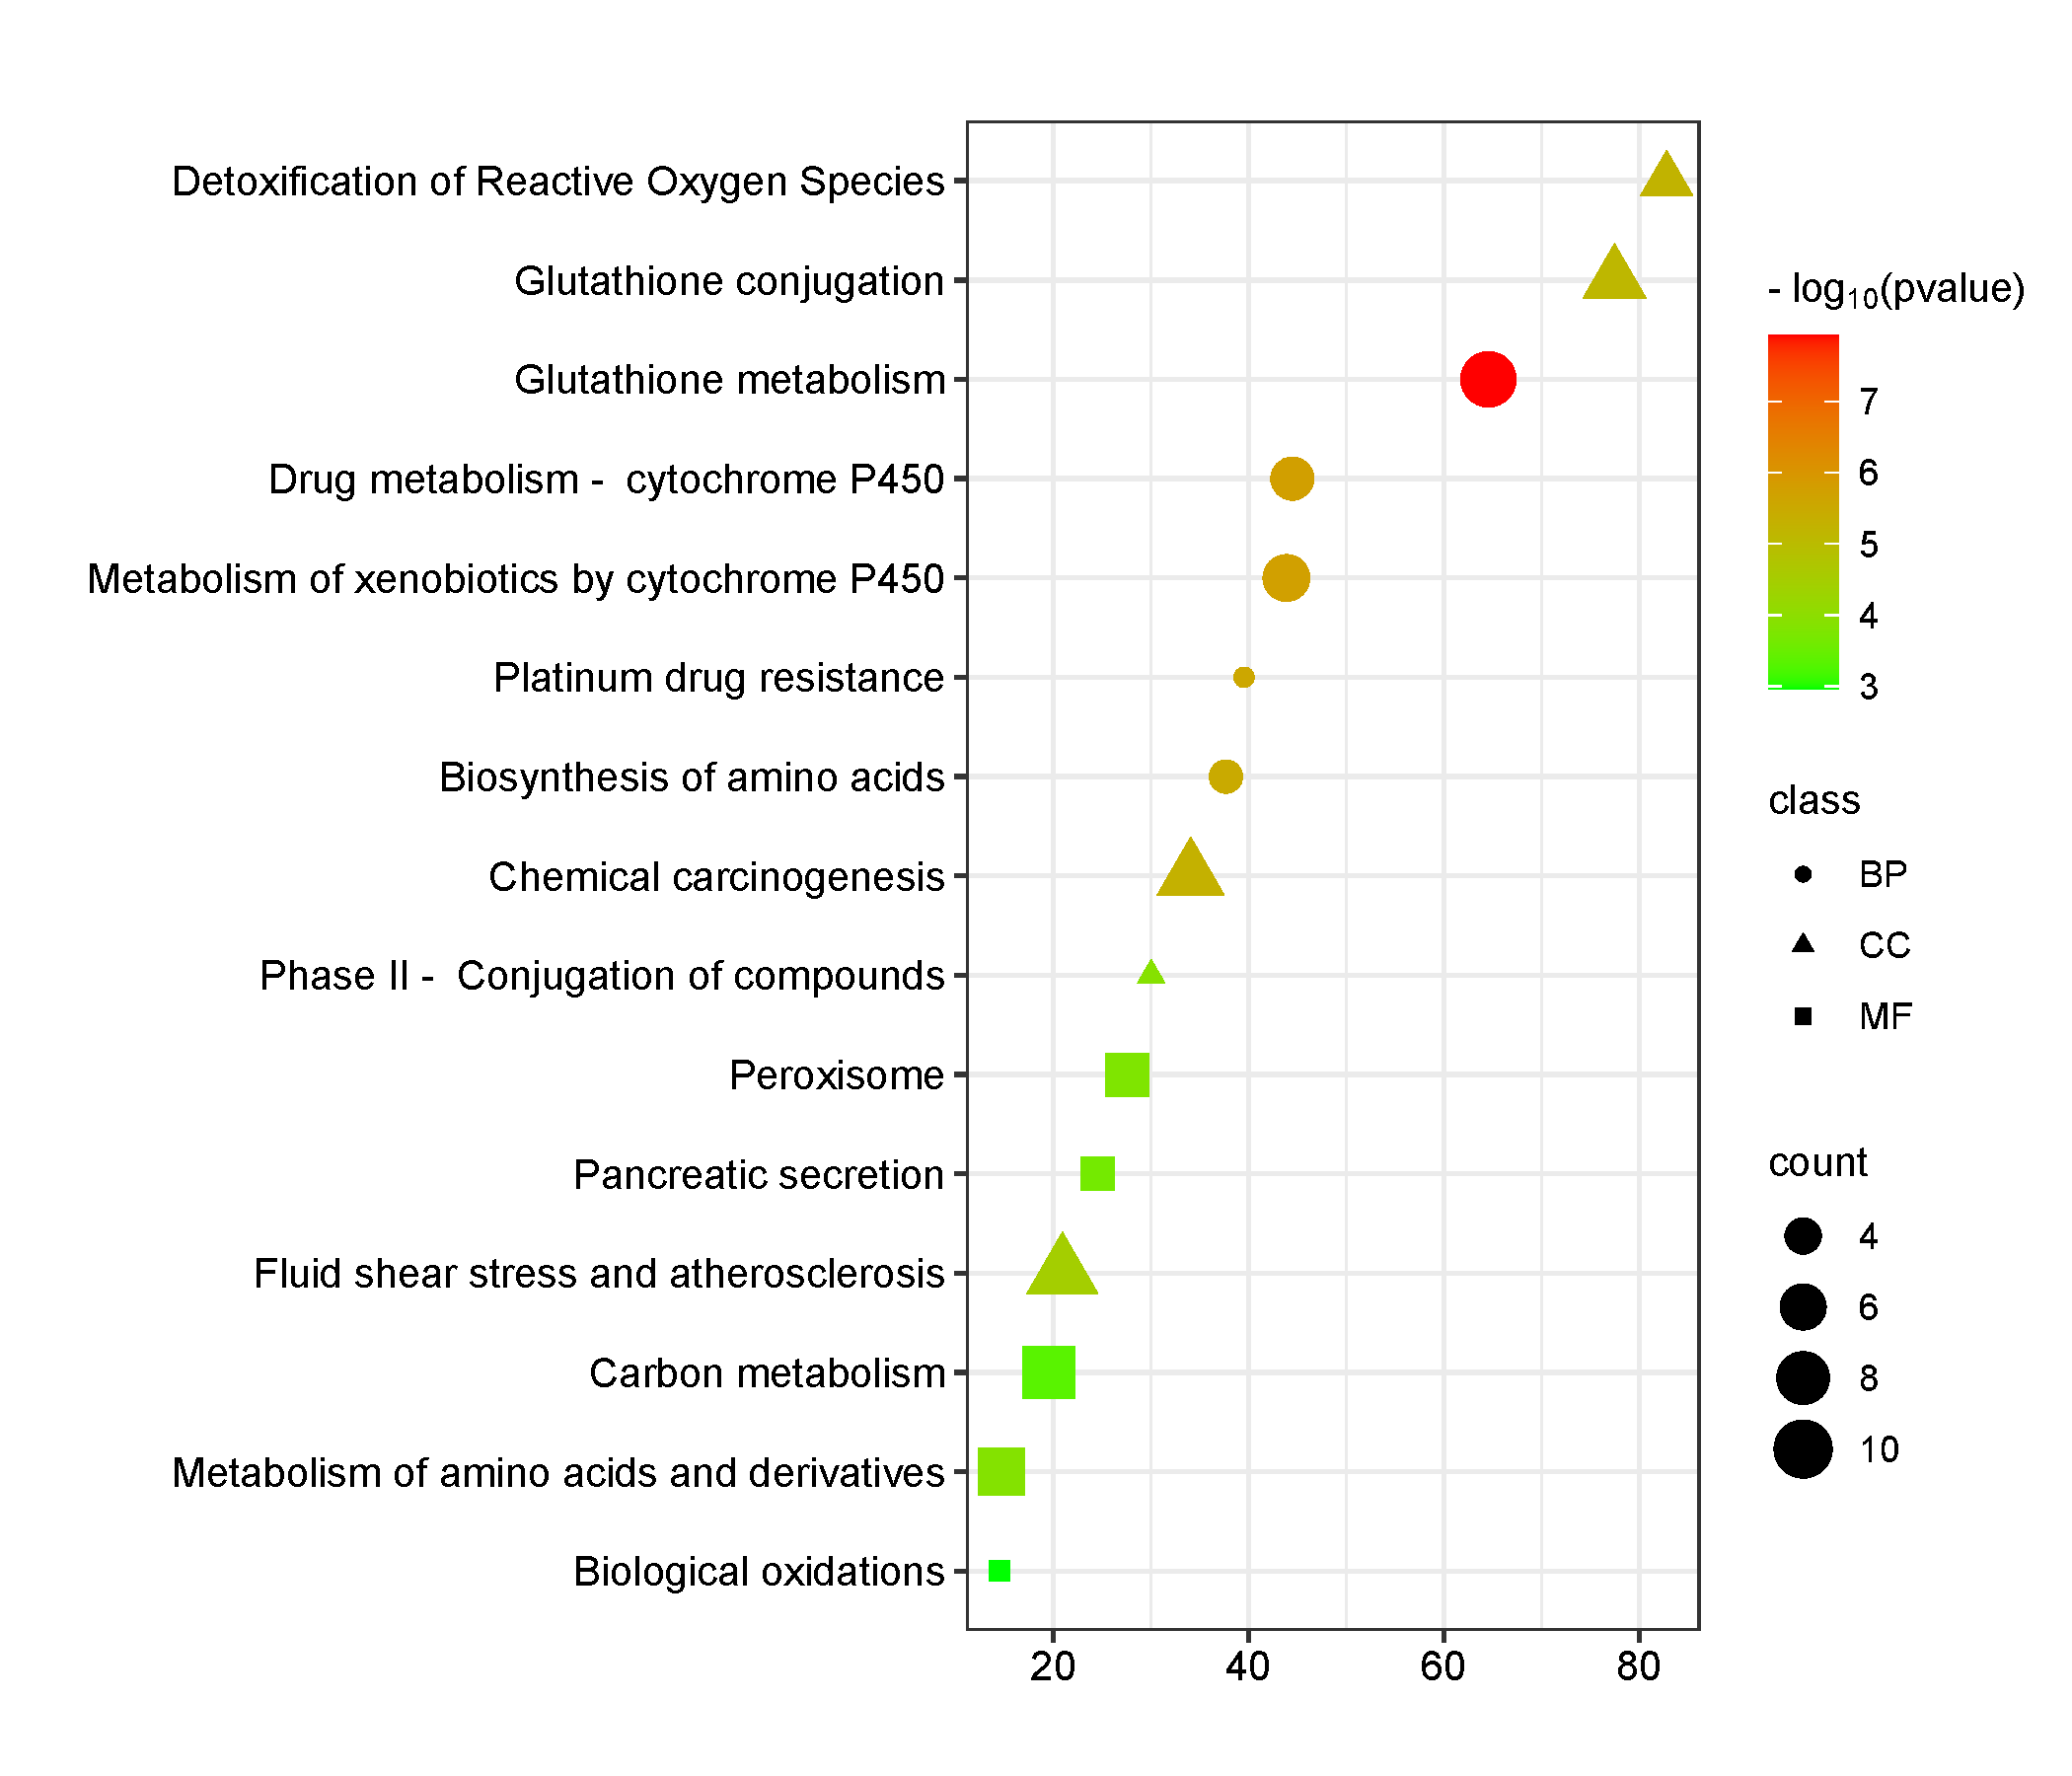
利用气泡图,将富集结果的p值以颜色表示,基因数用气泡大小表示,类别以不同的点形状表示。如何获得该数据,可以使用在线工具
metascape提交基因,计算富集,得到结果后进行绘图
数据说明
数据包括5列,第一列是分类(例如BP,CC,MF等),第二列是富集的名字(Y轴显示内容),第三列是富集倍数(X轴显示内容,若没有这个数据,可以用其他值代替,例如gene ratio等,都没有的话,1,用-log10(pvalue)代替这一列;2,用count代替这一列),第四列是p值(或者fdr,即图中的颜色,根据p值变化,此列必需是p值,范围0-1),第五列是基因数(气泡大小)
论文例子
Gene expression profiling and functional analysis reveals that p53 pathway-related gene expression is highly activated in cancer cells treated by cold atmospheric plasma-activated medium Fig 4
如何引用?
建议直接写网址。助力10000+篇
(google学术),9000+篇
(知网)论文
正式引用:Tang D, Chen M, Huang X, Zhang G, Zeng L, Zhang G, Wu S, Wang Y.
SRplot: A free online platform for data visualization and graphing. PLoS One. 2023 Nov 9;18(11):e0294236. doi: 10.1371/journal.pone.0294236. PMID: 37943830.
方法章节:Heatmap was plotted by https://www.bioinformatics.com.cn (last accessed on May 4, 2026), an online platform for data analysis and visualization.
致谢章节:We thank Mingjie Chen (Shanghai NewCore Biotechnology Co., Ltd.) for providing data analysis and visualization support.