配体-受体对热图(带连线)
简介
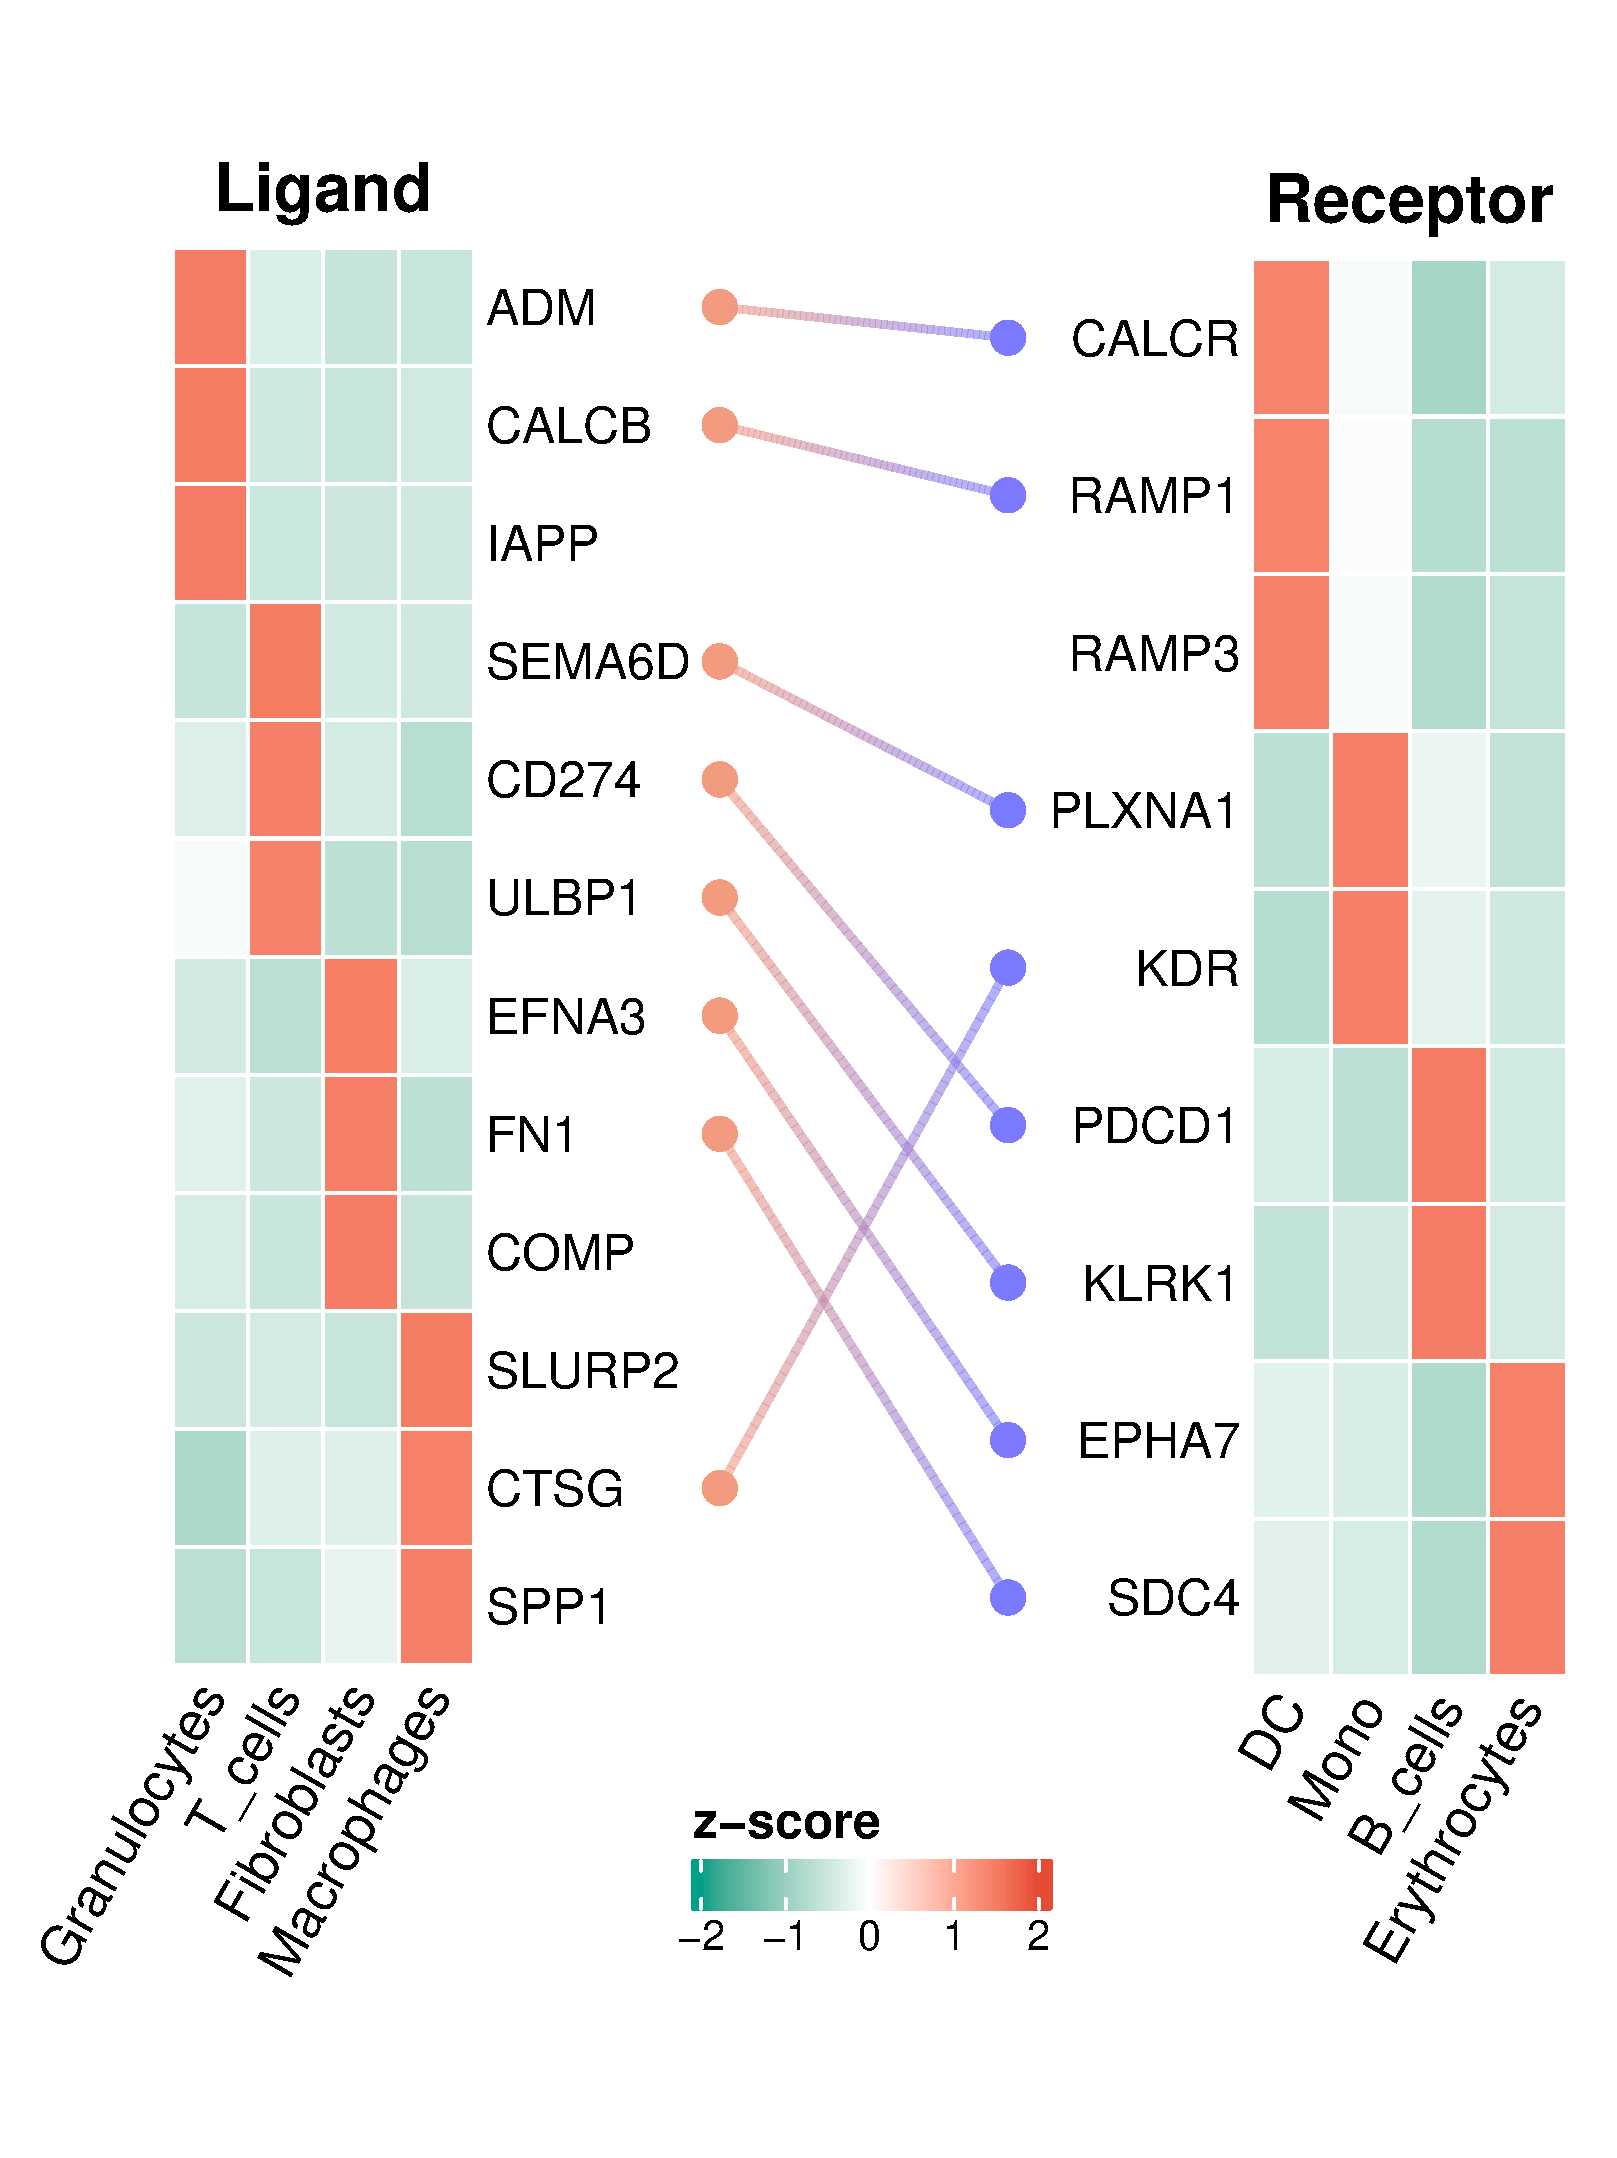
使用热图展示受体和配体基因的表达情况,使用连线表示受体-配体对。左侧是配体的热图,行是基因,列是样品(或细胞类型);右侧是受体的热图,行是基因,列是样品(或细胞类型)。
中间以点-线-点的形式展示配体-受体对。
数据说明
输入包括3个:
1)左侧热图数据:矩阵形式,行是样品(或细胞类型),列是基因;
2)右侧热图数据:矩阵形式,行是样品(或细胞类型),列是基因;
3)中间配对关系数据:两列,左侧基因名,右侧基因名。其中热图的标题来自首行的第一列和第二列。
论文例子
Advantages of Single-Nucleus over Single-Cell RNA Sequencing of Adult Kidney: Rare Cell Types and Novel Cell States Revealed in Fibrosis. Fig4F
如何引用?
建议直接写网址。助力10000+篇
(google学术),9000+篇
(知网)论文
正式引用:Tang D, Chen M, Huang X, Zhang G, Zeng L, Zhang G, Wu S, Wang Y.
SRplot: A free online platform for data visualization and graphing. PLoS One. 2023 Nov 9;18(11):e0294236. doi: 10.1371/journal.pone.0294236. PMID: 37943830.
方法章节:Heatmap was plotted by https://www.bioinformatics.com.cn (last accessed on May 4, 2026), an online platform for data analysis and visualization.
致谢章节:We thank Mingjie Chen (Shanghai NewCore Biotechnology Co., Ltd.) for providing data analysis and visualization support.