基因表达雷达图(radar chart)
简介
使用
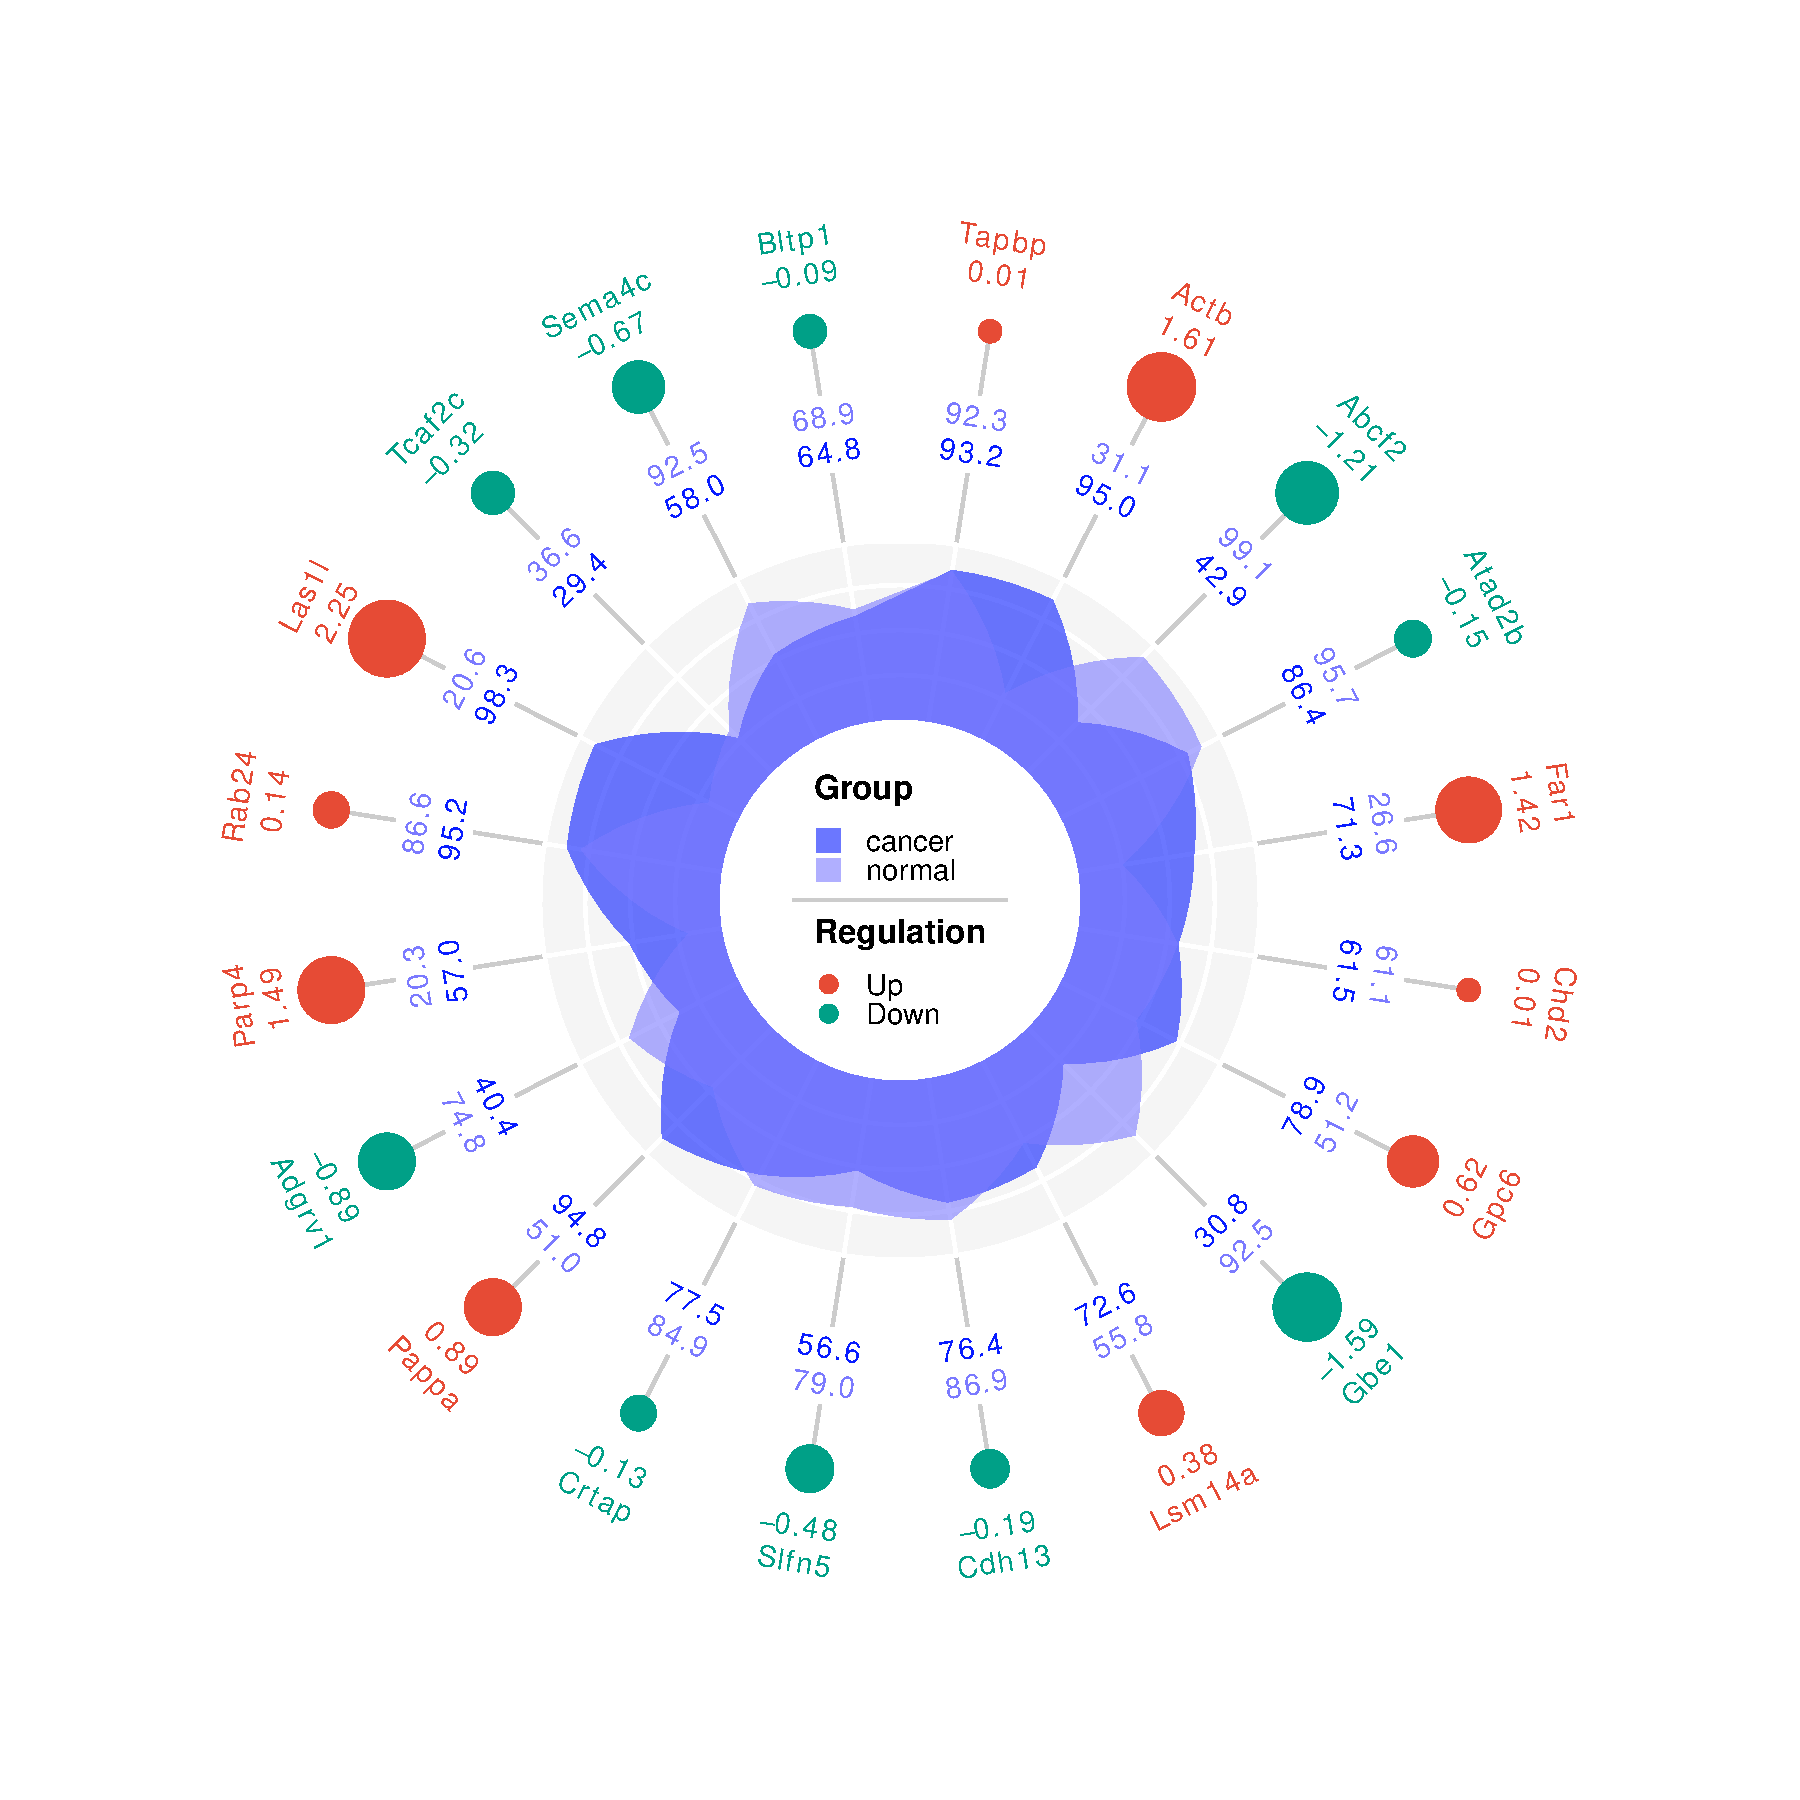
雷达图展示差异表达基因的表达值,倍数变化。从外到内依次为:基因名,基因在两组间的log2fc,|log2fc|的点图,组1和组2的表达值,表达值雷达图,图例。
数据说明
输入为4列。第1列是基因名,第2列是组1的表达值,第3列是组2的表达值,第4列是两组间的log2fc(注:log2fc不一定等于直接用log2(组1/组2),不影响)。
论文例子
Transcriptome Analysis Reveals the Effect of Stocking Density on Energy Metabolism in the Gills of Cherax quadricarinatus under Rice-Crayfish Co-Culture. fig2d
如何引用?
建议直接写网址。助力10000+篇
(google学术),9000+篇
(知网)论文
正式引用:Tang D, Chen M, Huang X, Zhang G, Zeng L, Zhang G, Wu S, Wang Y.
SRplot: A free online platform for data visualization and graphing. PLoS One. 2023 Nov 9;18(11):e0294236. doi: 10.1371/journal.pone.0294236. PMID: 37943830.
方法章节:Heatmap was plotted by https://www.bioinformatics.com.cn (last accessed on May 4, 2026), an online platform for data analysis and visualization.
致谢章节:We thank Mingjie Chen (Shanghai NewCore Biotechnology Co., Ltd.) for providing data analysis and visualization support.