双曲线火山图
简介
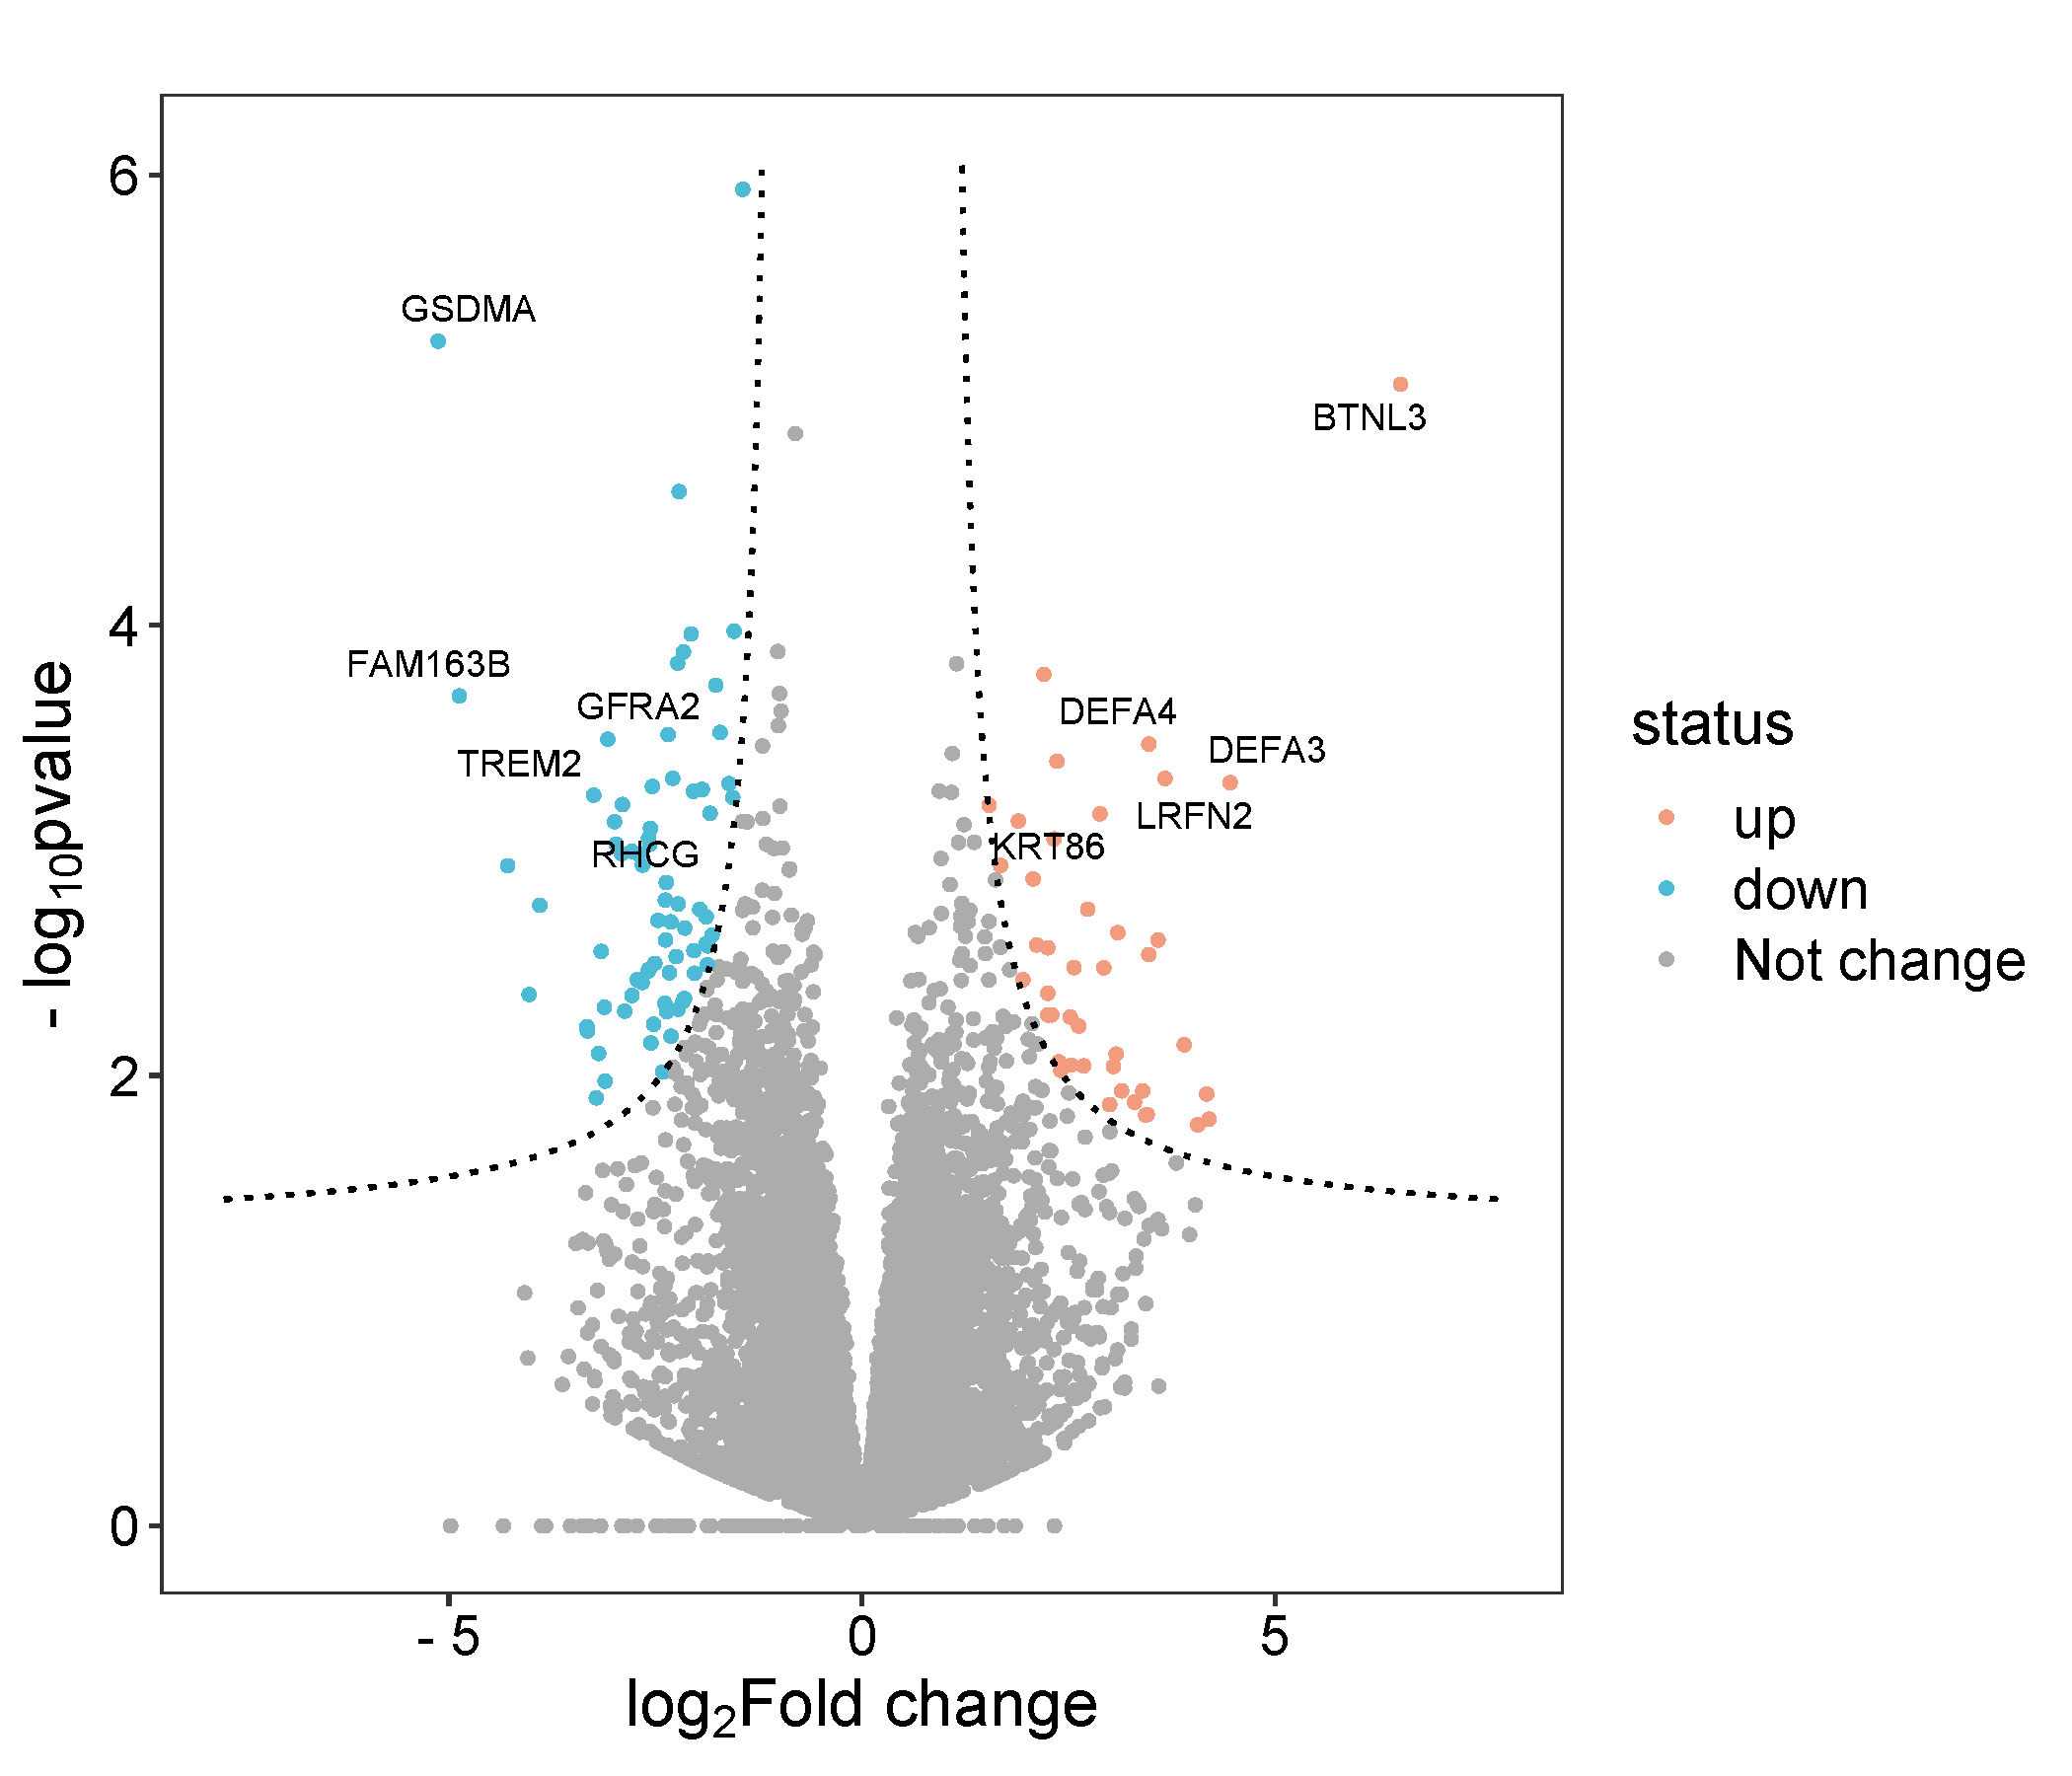
在传统火山图的基础上,分别以原阈值线为基准,添加两条原始函数为y=1/x的曲线。对基因进行分类,有利于筛选差异更显著的基因。调用ggplot2 R包
数据说明
输入数据为4列,第一列是名字(唯一),第二列是log2FC(有正有负),第三列是p值(或者FDR)
论文例子
Proteomics of Melanoma Response to Immunotherapy Reveals Mitochondrial Dependence. Fig3C
如何引用?
建议直接写网址。助力10000+篇
(google学术),9000+篇
(知网)论文
正式引用:Tang D, Chen M, Huang X, Zhang G, Zeng L, Zhang G, Wu S, Wang Y.
SRplot: A free online platform for data visualization and graphing. PLoS One. 2023 Nov 9;18(11):e0294236. doi: 10.1371/journal.pone.0294236. PMID: 37943830.
方法章节:Heatmap was plotted by https://www.bioinformatics.com.cn (last accessed on May 4, 2026), an online platform for data analysis and visualization.
致谢章节:We thank Mingjie Chen (Shanghai NewCore Biotechnology Co., Ltd.) for providing data analysis and visualization support.