scRNA-seq UMAP,t-SNE降维图
简介
单细胞UMAP图是一种基于流形学习的降维可视化方法,用于展示单细胞转录组数据的细胞群体结构和潜在的细胞状态。它通过非线性降维将高维数据映射到二维或三维空间,保留数据的局部结构,便于观察细胞聚类和细胞类型间的连续性。
数据说明
输入为seurat对象rds文件。点击“Rdata信息获取”按钮,会返回seurat对象中meta.data列的描述性信息,请根据这些列的信息选择绘图关键词,默认使用ident(即细胞注释)上色。调用scRNAtoolVis R包绘图
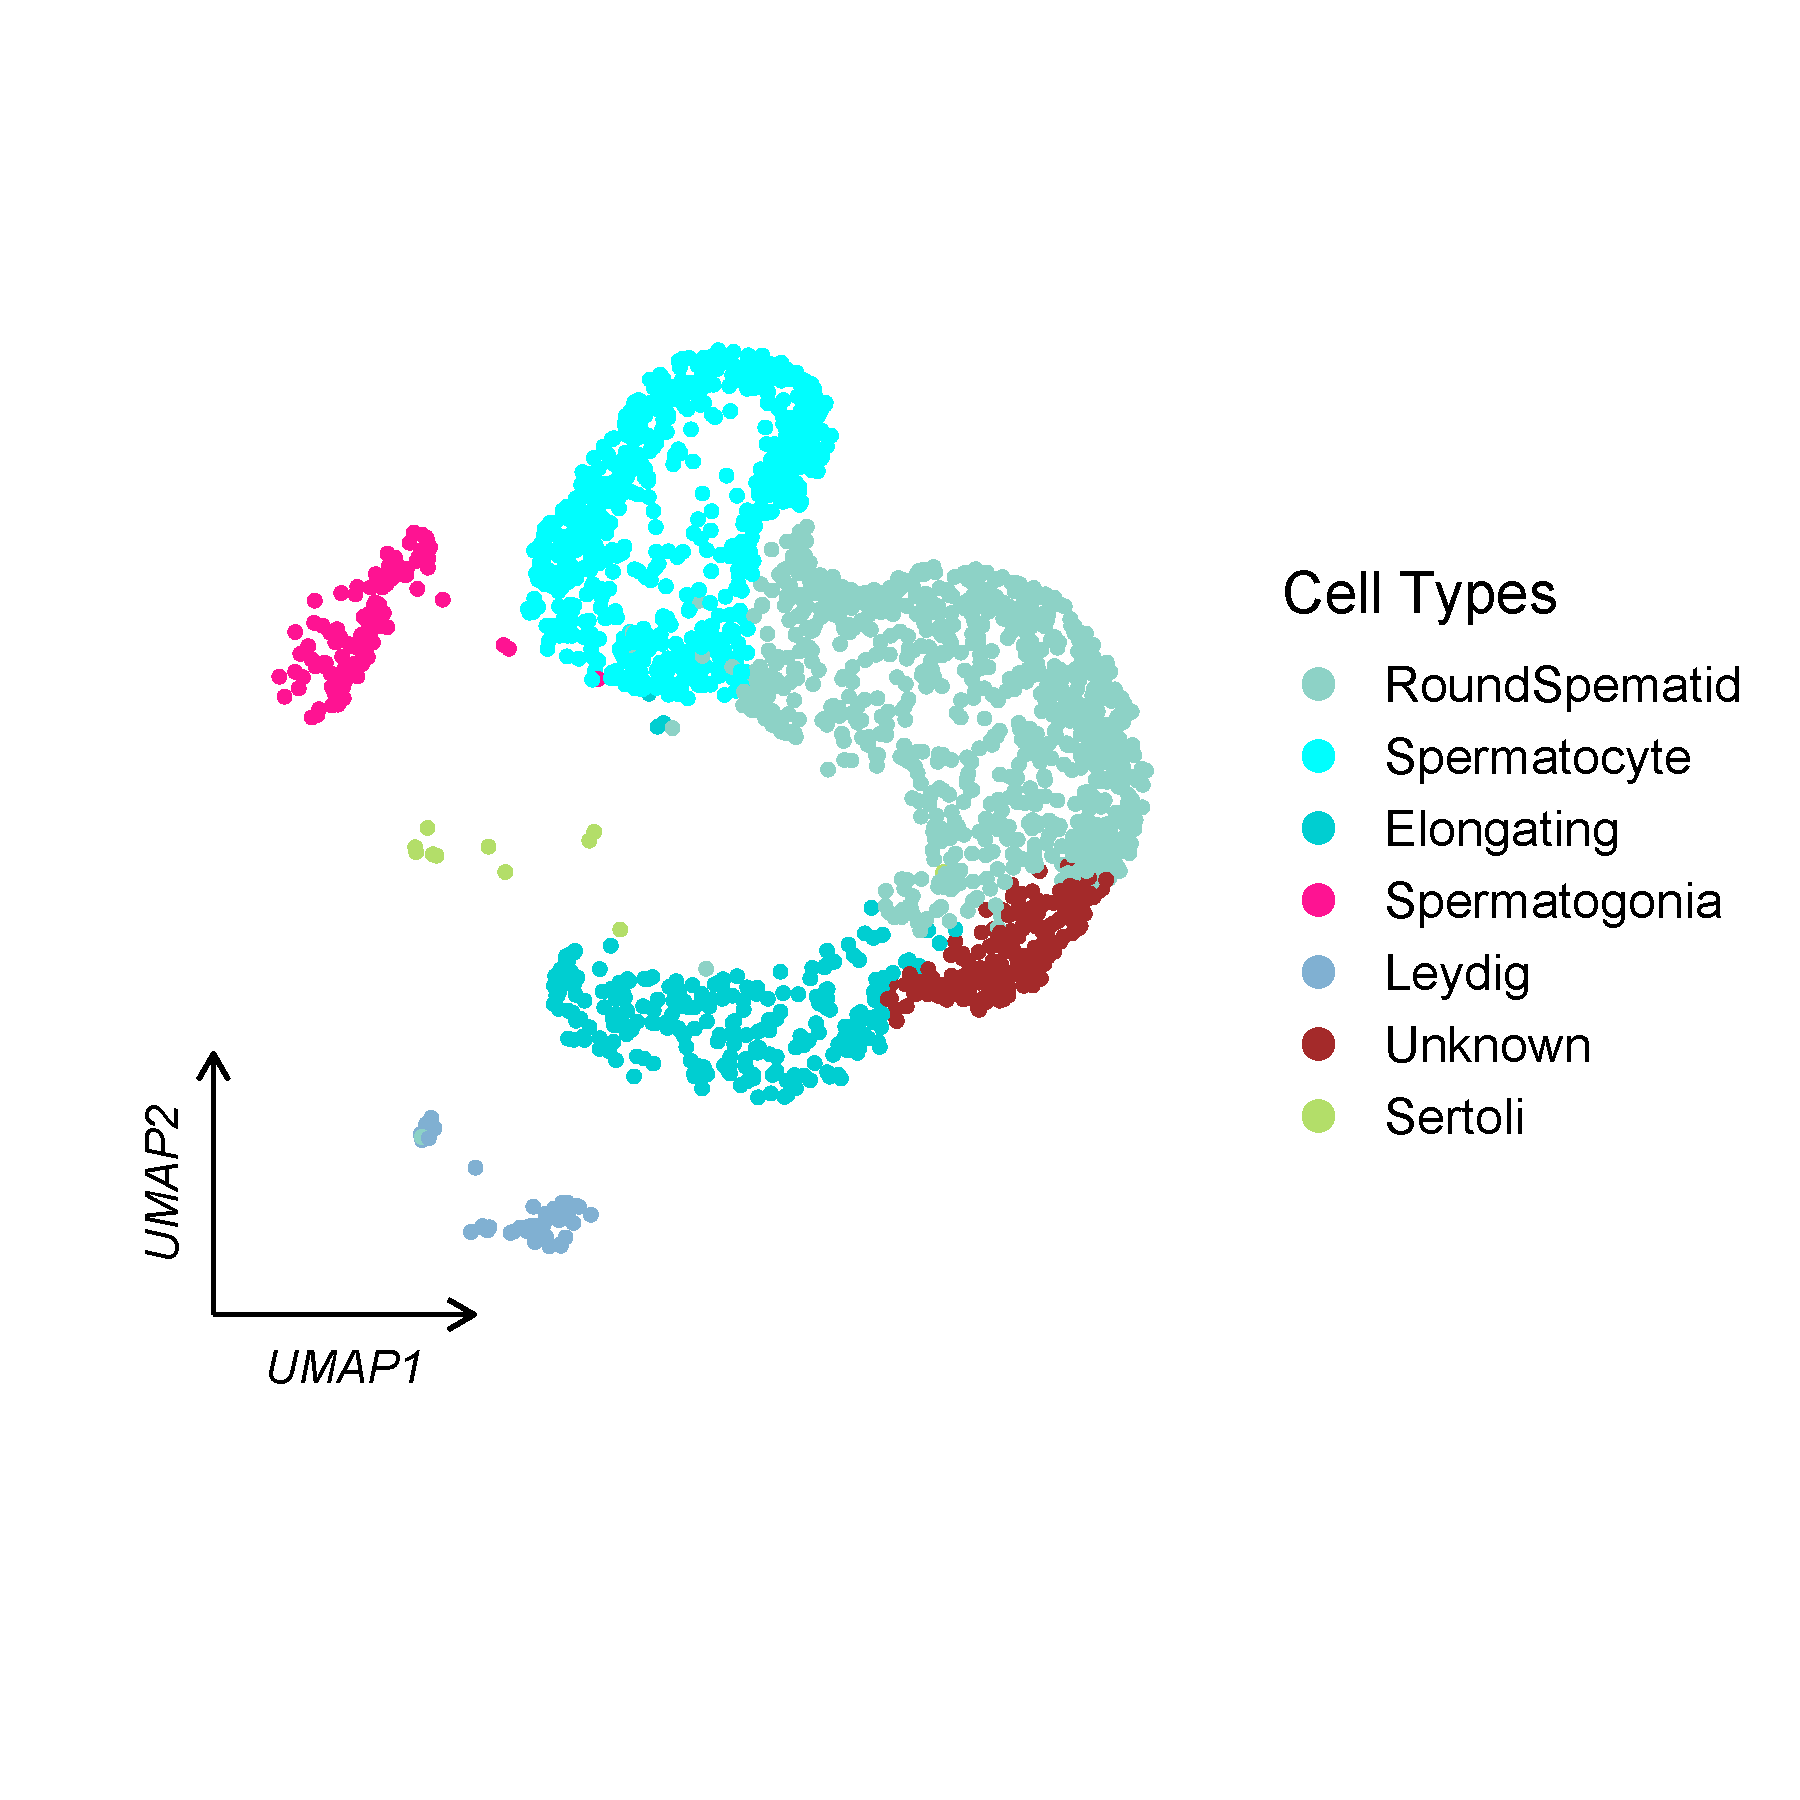
输出为UMAP降维图。左下角为带箭头的角轴线;主图表示细胞群,每个点代表一个细胞。不同的颜色表示不同的细胞类型
论文例子
Distinct cellular mechanisms underlie chemotherapies and PD-L1 blockade combinations in triple-negative breast cancer. Fig1B
如何引用?
建议直接写网址。助力10000+篇
(google学术),9000+篇
(知网)论文
正式引用:Tang D, Chen M, Huang X, Zhang G, Zeng L, Zhang G, Wu S, Wang Y.
SRplot: A free online platform for data visualization and graphing. PLoS One. 2023 Nov 9;18(11):e0294236. doi: 10.1371/journal.pone.0294236. PMID: 37943830.
方法章节:Heatmap was plotted by https://www.bioinformatics.com.cn (last accessed on May 4, 2026), an online platform for data analysis and visualization.
致谢章节:We thank Mingjie Chen (Shanghai NewCore Biotechnology Co., Ltd.) for providing data analysis and visualization support.