双层饼图(two layer pie plot)
简介
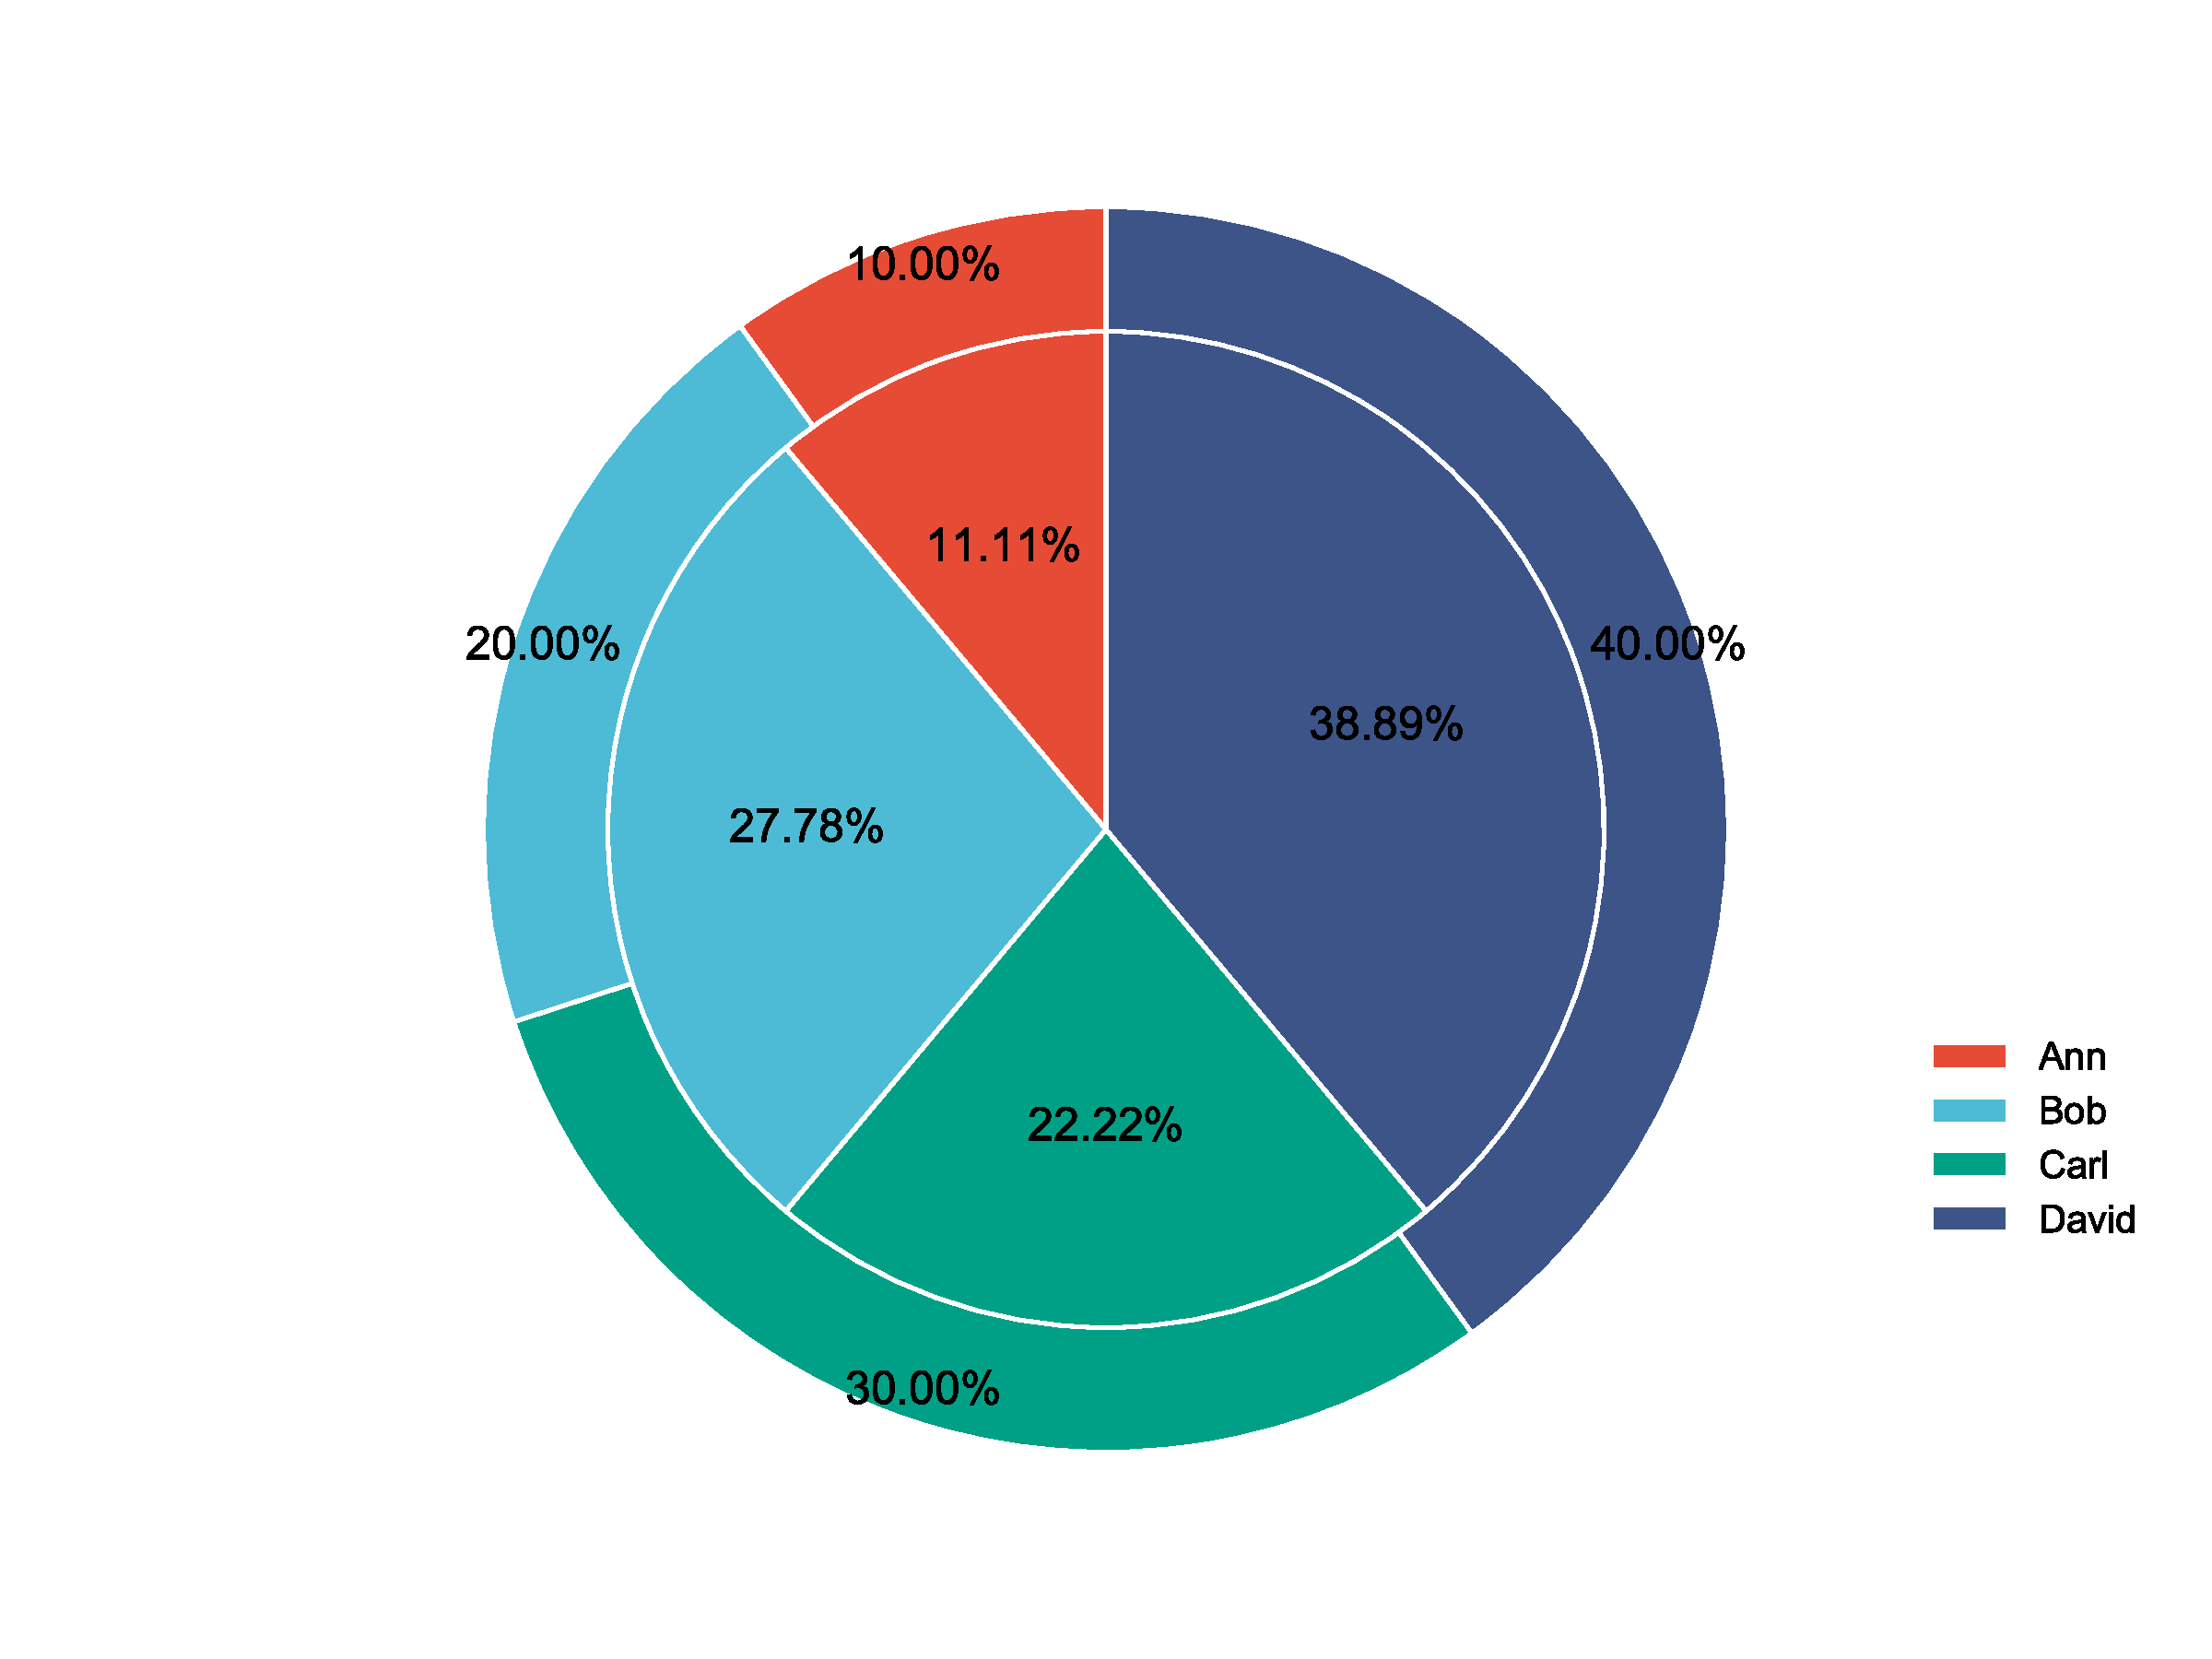
在常规饼图外,再嵌套一层饼图,双层饼图
数据说明
数据包含3行,第1列是说明,第2行是外圈数值,第3行是内圈数值。
论文例子
Intertumoral Genetic Heterogeneity Generates Distinct Tumor Microenvironments in a Novel Murine Synchronous Melanoma Model. Fig3a
论文写作
Nested pie charts demonstrating distributions of various CD45+ immune cell subsets in synchronous ER (ER + Y) and Y (ER + Y) tumors with Y tumor as the inside pie and ER tumor the outside pie.
|
输入
|
items	Ann	Bob	Carl	David
day1	1	2	3	4
day2	2	5	4	7
|
| 输出 |
|
如何引用?
建议直接写网址。助力10000+篇
(google学术),9000+篇
(知网)论文
正式引用:Tang D, Chen M, Huang X, Zhang G, Zeng L, Zhang G, Wu S, Wang Y.
SRplot: A free online platform for data visualization and graphing. PLoS One. 2023 Nov 9;18(11):e0294236. doi: 10.1371/journal.pone.0294236. PMID: 37943830.
方法章节:Heatmap was plotted by https://www.bioinformatics.com.cn (last accessed on May 4, 2026), an online platform for data analysis and visualization.
致谢章节:We thank Mingjie Chen (Shanghai NewCore Biotechnology Co., Ltd.) for providing data analysis and visualization support.
