桑基图(sankey diagram)
简介
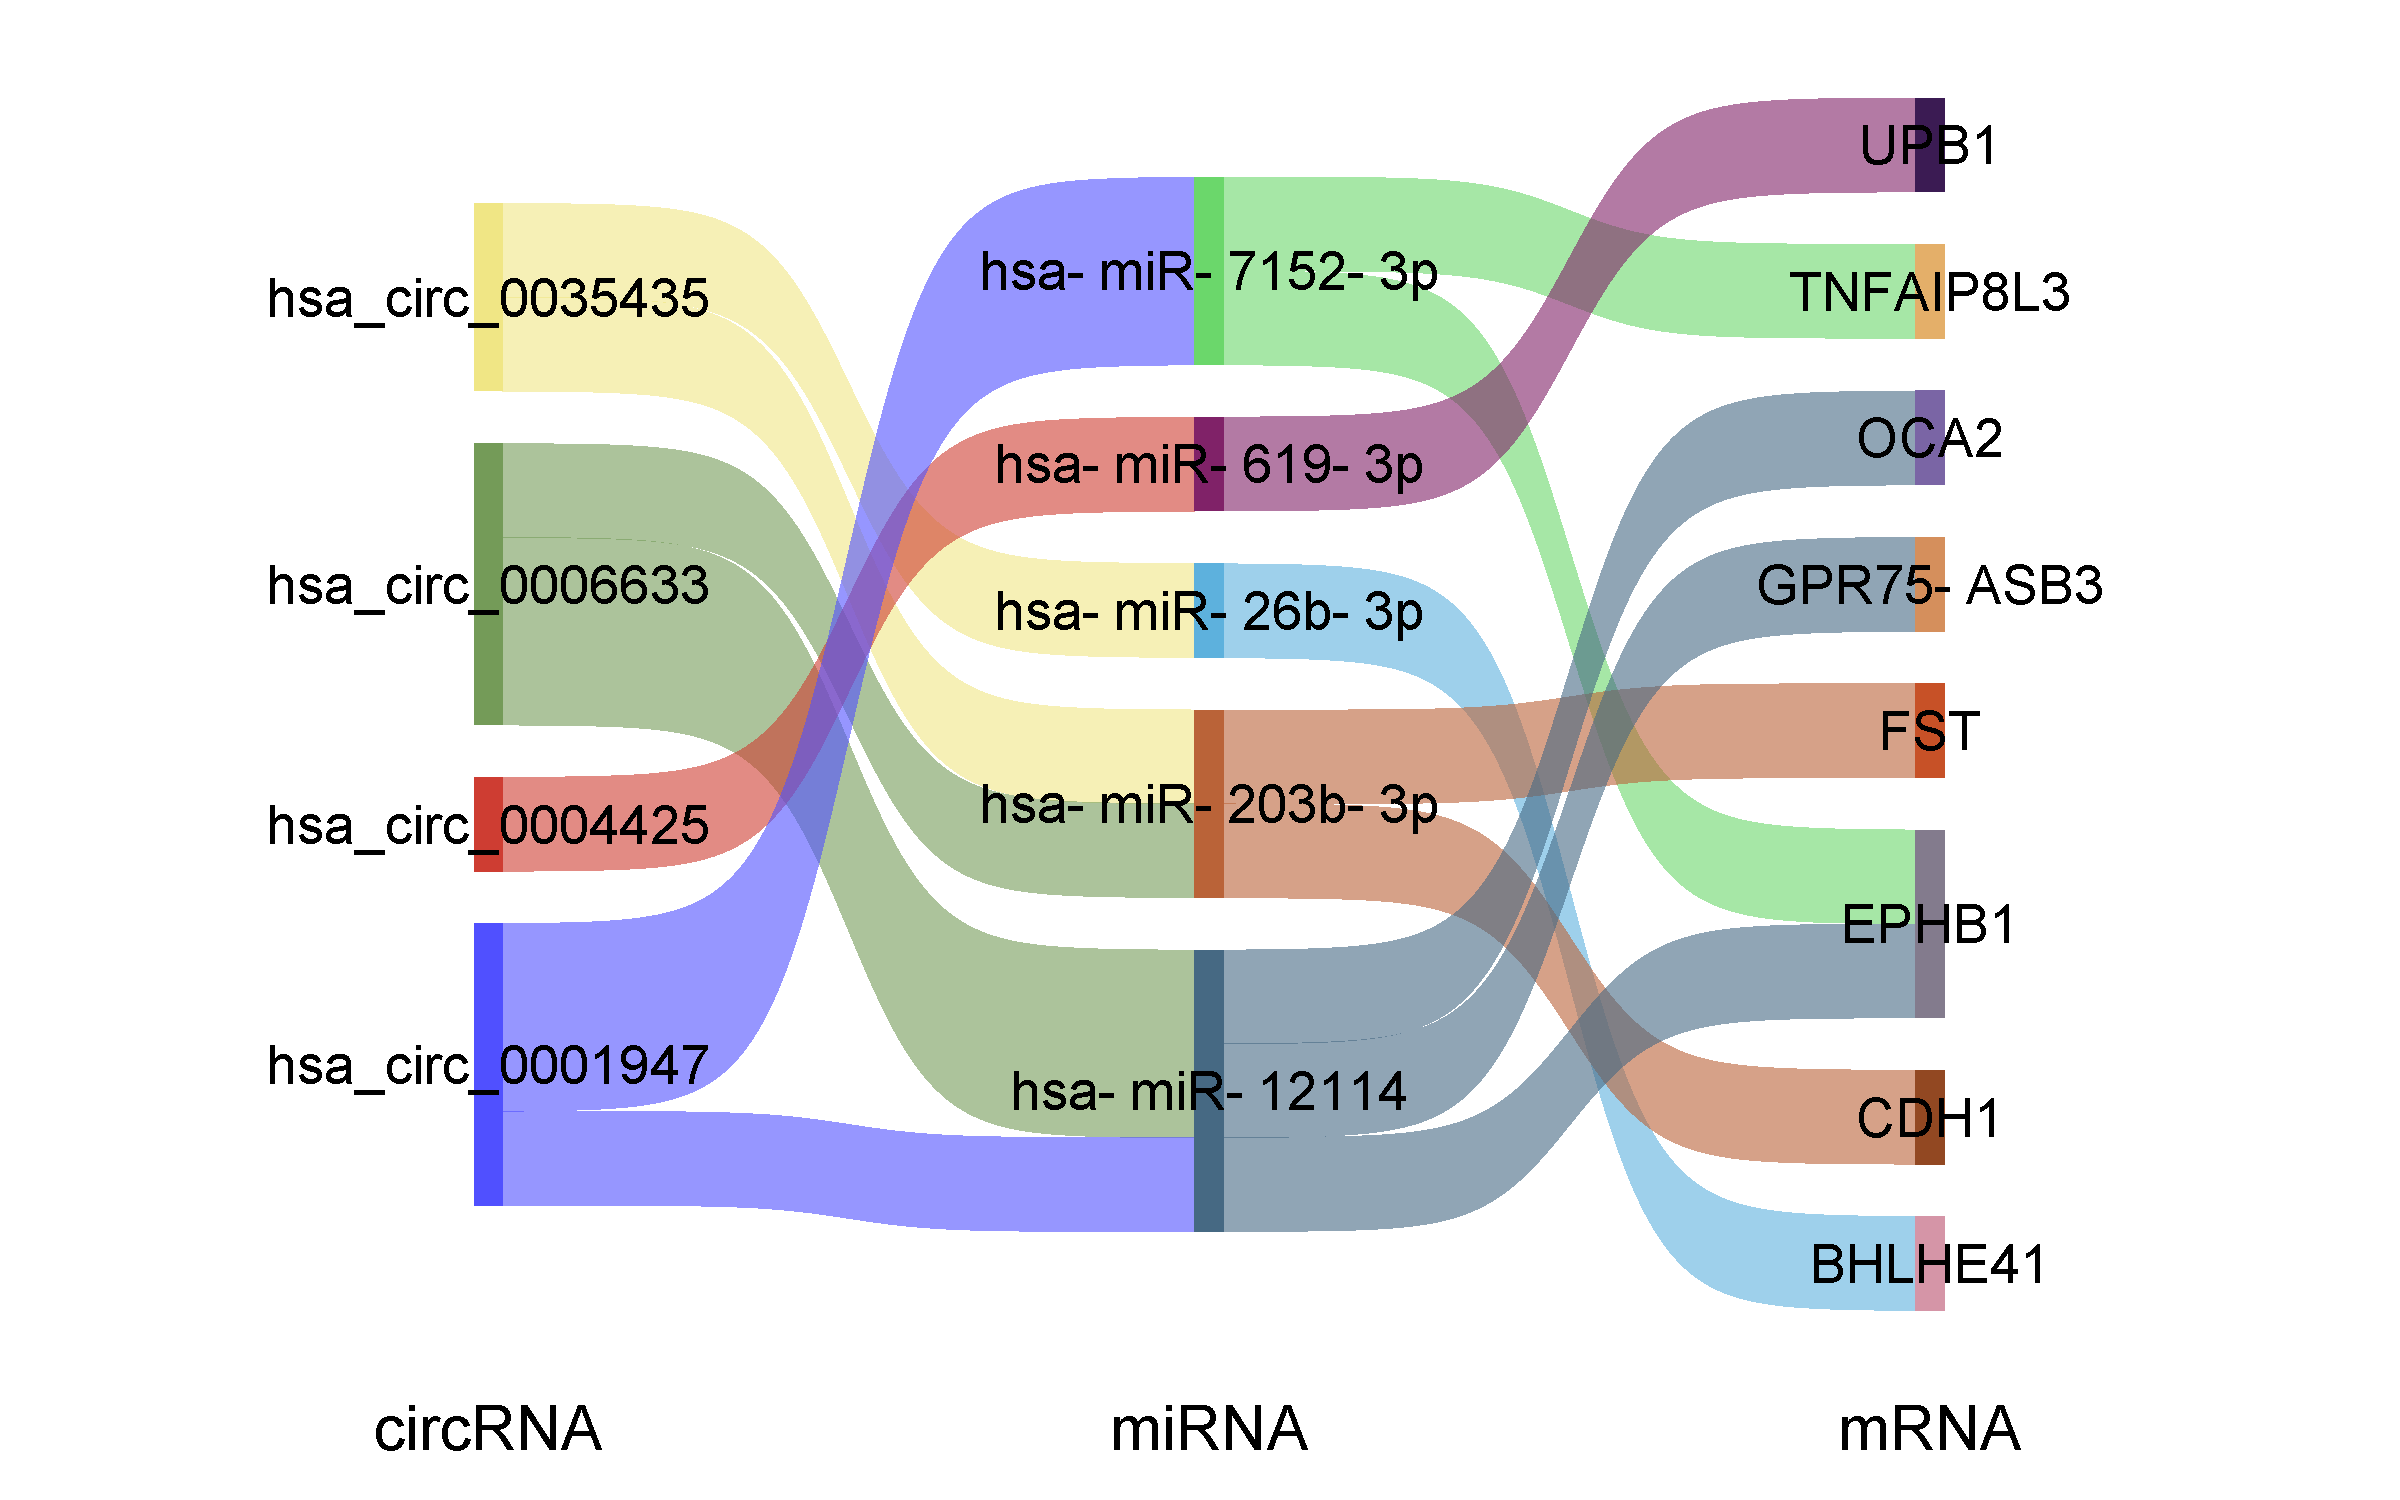
根据数据的流向进行绘图,可以从左到右展示数据的拆分与组合,隶属关系等。调用ggsankey
数据说明
数据为矩阵形式,列为类别,行为数据流。至少2列数据
论文例子
Accelerating 3D printing of pharmaceutical products using machine learning. Fig5
如何引用?
建议直接写网址。助力10000+篇
(google学术),9000+篇
(知网)论文
正式引用:Tang D, Chen M, Huang X, Zhang G, Zeng L, Zhang G, Wu S, Wang Y.
SRplot: A free online platform for data visualization and graphing. PLoS One. 2023 Nov 9;18(11):e0294236. doi: 10.1371/journal.pone.0294236. PMID: 37943830.
方法章节:Heatmap was plotted by https://www.bioinformatics.com.cn (last accessed on May 4, 2026), an online platform for data analysis and visualization.
致谢章节:We thank Mingjie Chen (Shanghai NewCore Biotechnology Co., Ltd.) for providing data analysis and visualization support.