成比例文氏图(venn diagram)
简介
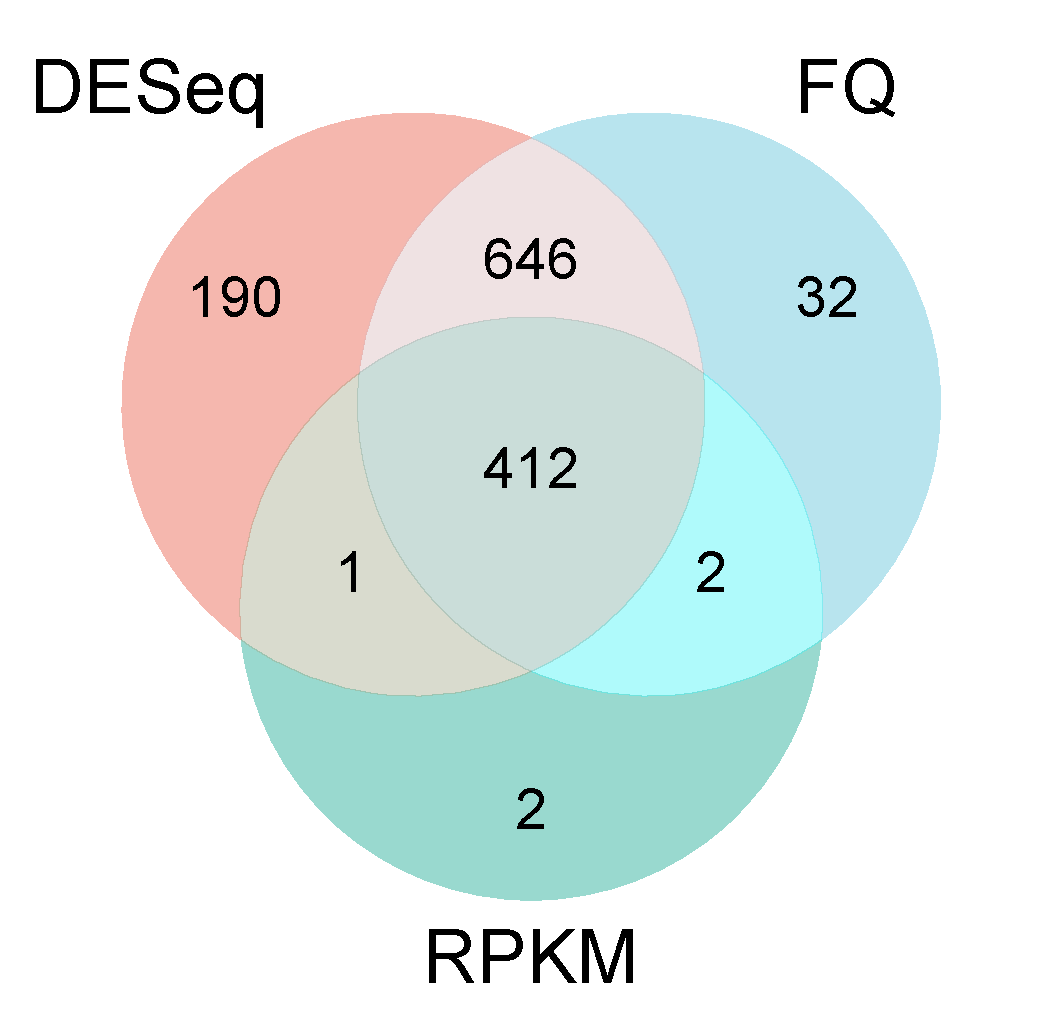
使用2个或者3个圈来表示数据集,使用重叠区表示共有部分。展示数据集间的共有和特异情况。可以是基因list,蛋白list,代谢物list等等。应用场景包括:1)共同上调基因;2)靶基因预测;3)多组学联合分析等
数据说明
每个数据集包括:一个数据集名字,一个数据集对应的基因list。每行一个基因。
论文例子
Identification of the active substances and mechanisms of ginger for the treatment of colon cancer based on network pharmacology and molecular docking
如何引用?
建议直接写网址。助力10000+篇
(google学术),9000+篇
(知网)论文
正式引用:Tang D, Chen M, Huang X, Zhang G, Zeng L, Zhang G, Wu S, Wang Y.
SRplot: A free online platform for data visualization and graphing. PLoS One. 2023 Nov 9;18(11):e0294236. doi: 10.1371/journal.pone.0294236. PMID: 37943830.
方法章节:Heatmap was plotted by https://www.bioinformatics.com.cn (last accessed on May 4, 2026), an online platform for data analysis and visualization.
致谢章节:We thank Mingjie Chen (Shanghai NewCore Biotechnology Co., Ltd.) for providing data analysis and visualization support.