pie of pie
简介
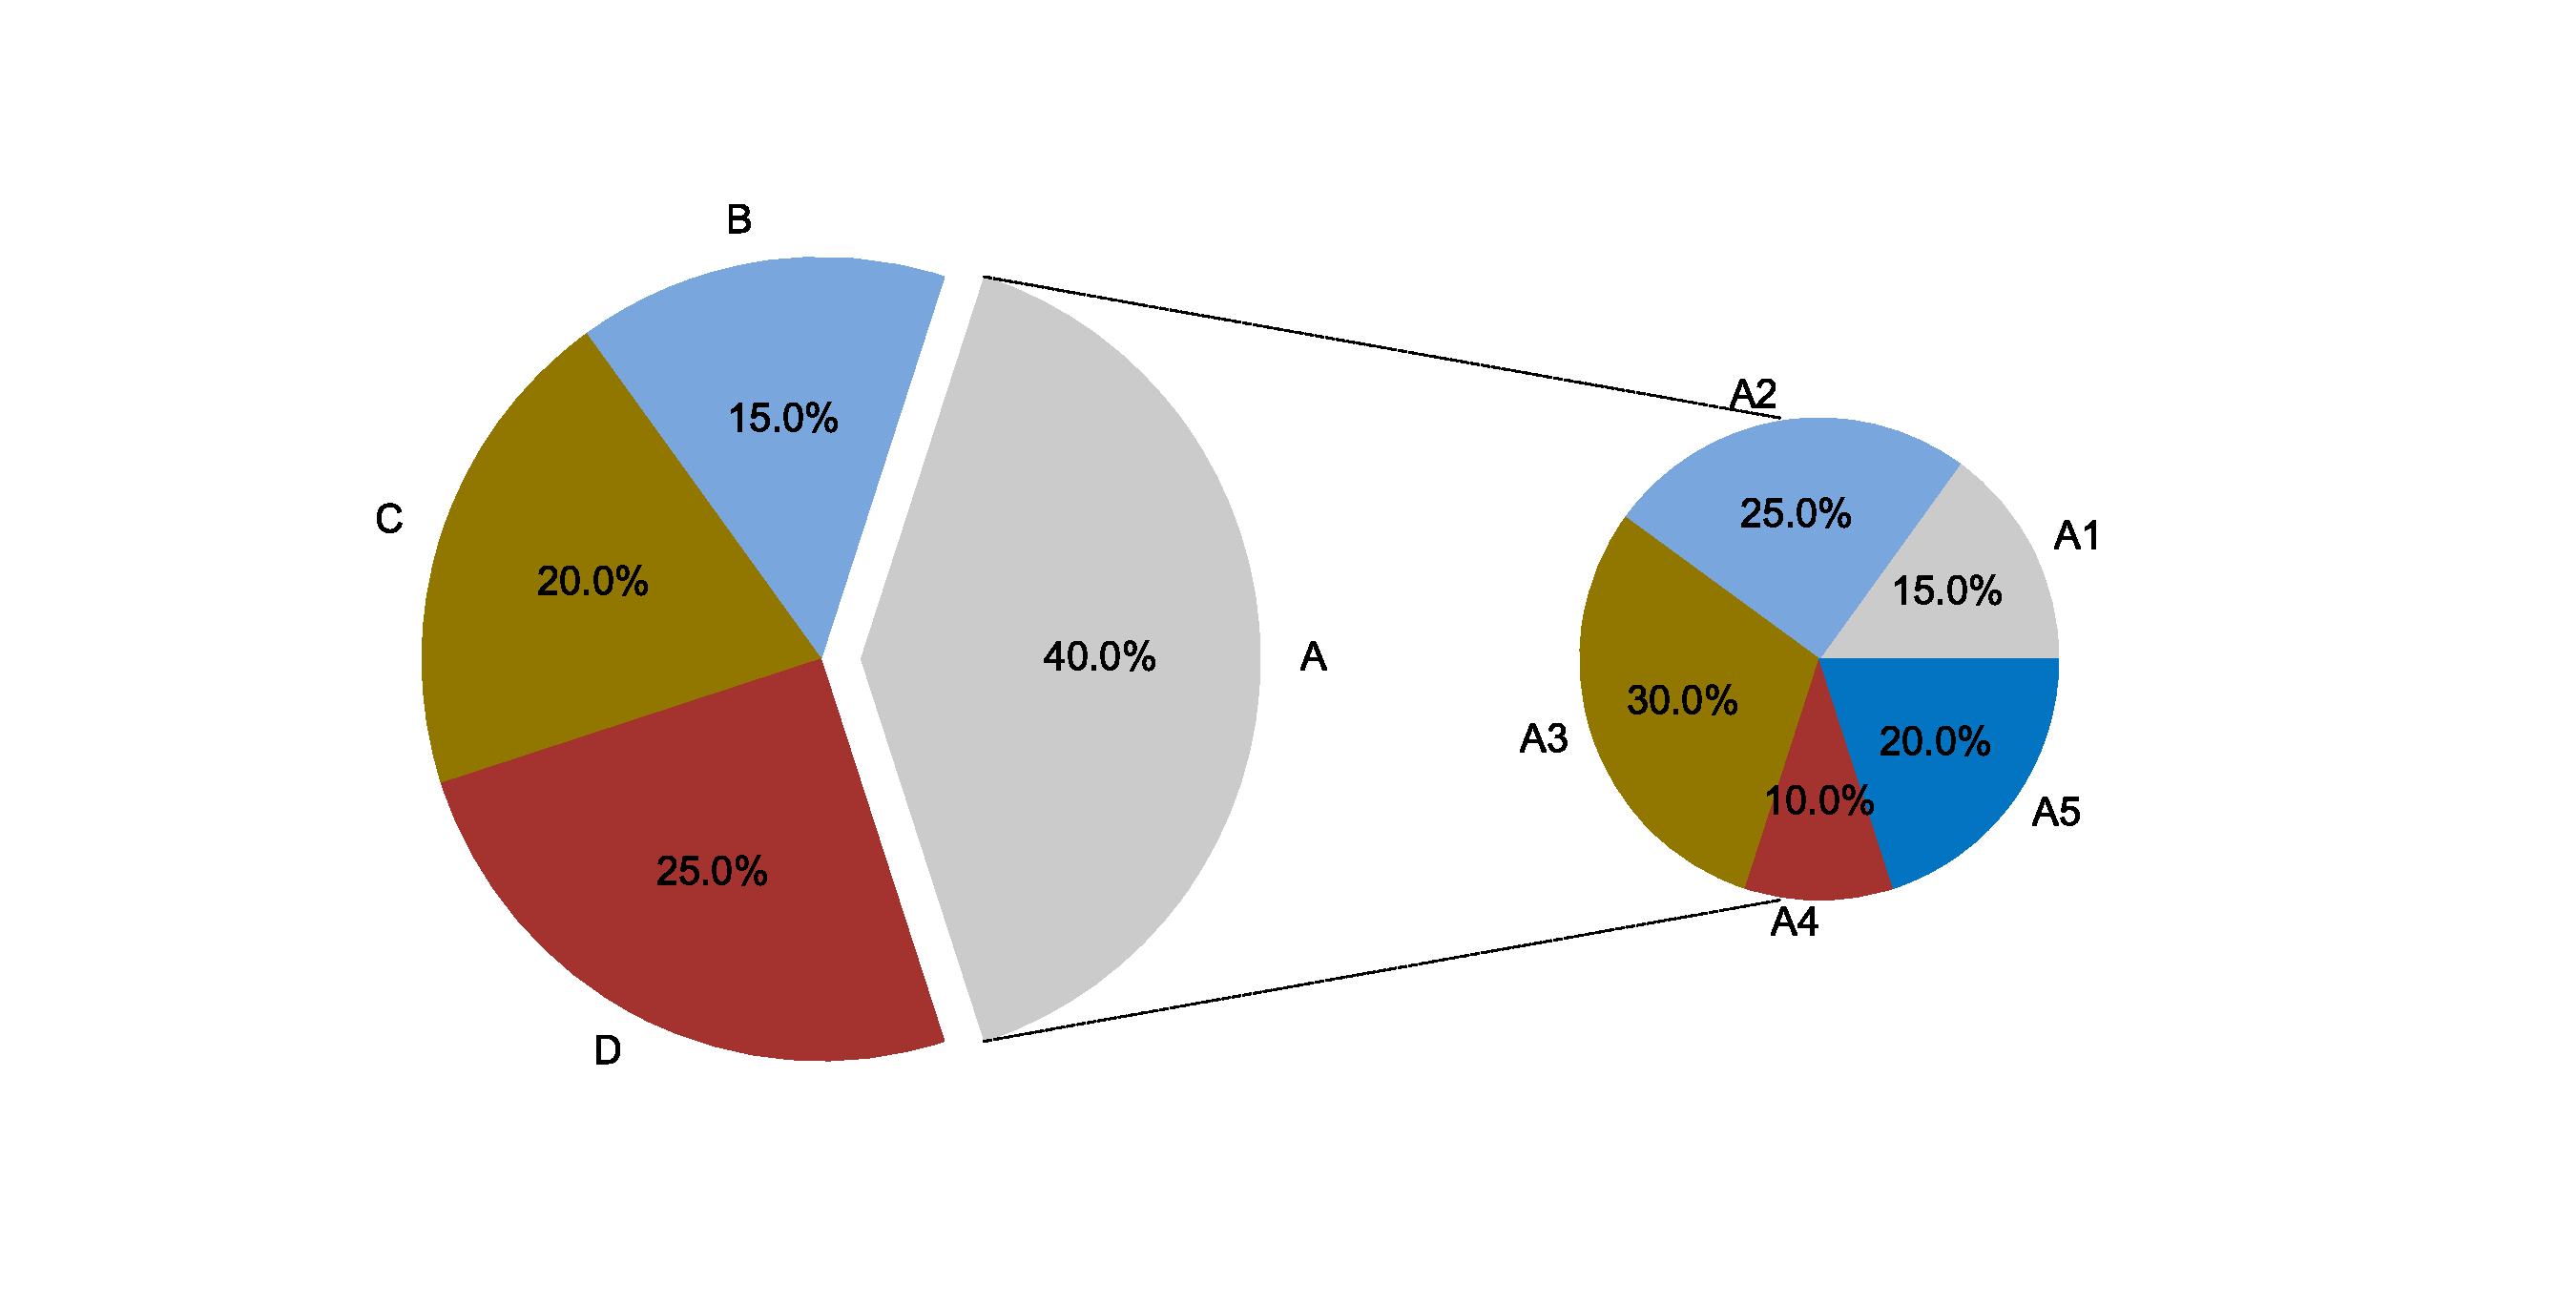
将左侧饼图中的一部分在右侧以较小的饼图详细呈现出来,并使用连线连接两部分图片
数据说明
输入数据包括2个,左侧pie数据,第一列是名字,第二列是比例(必需是比例,此列和为1)。右侧pie数据,第一列是名字,第二列是数值(不强制此列为比例)。默认最多6个数据。
论文例子
Variation in Raw Milk Microbiota Throughout 12 Months and the Impact of Weather Conditions. fig2
如何引用?
建议直接写网址。助力10000+篇
(google学术),9000+篇
(知网)论文
正式引用:Tang D, Chen M, Huang X, Zhang G, Zeng L, Zhang G, Wu S, Wang Y.
SRplot: A free online platform for data visualization and graphing. PLoS One. 2023 Nov 9;18(11):e0294236. doi: 10.1371/journal.pone.0294236. PMID: 37943830.
方法章节:Heatmap was plotted by https://www.bioinformatics.com.cn (last accessed on May 4, 2026), an online platform for data analysis and visualization.
致谢章节:We thank Mingjie Chen (Shanghai NewCore Biotechnology Co., Ltd.) for providing data analysis and visualization support.