矩阵点图(dotplot)
简介
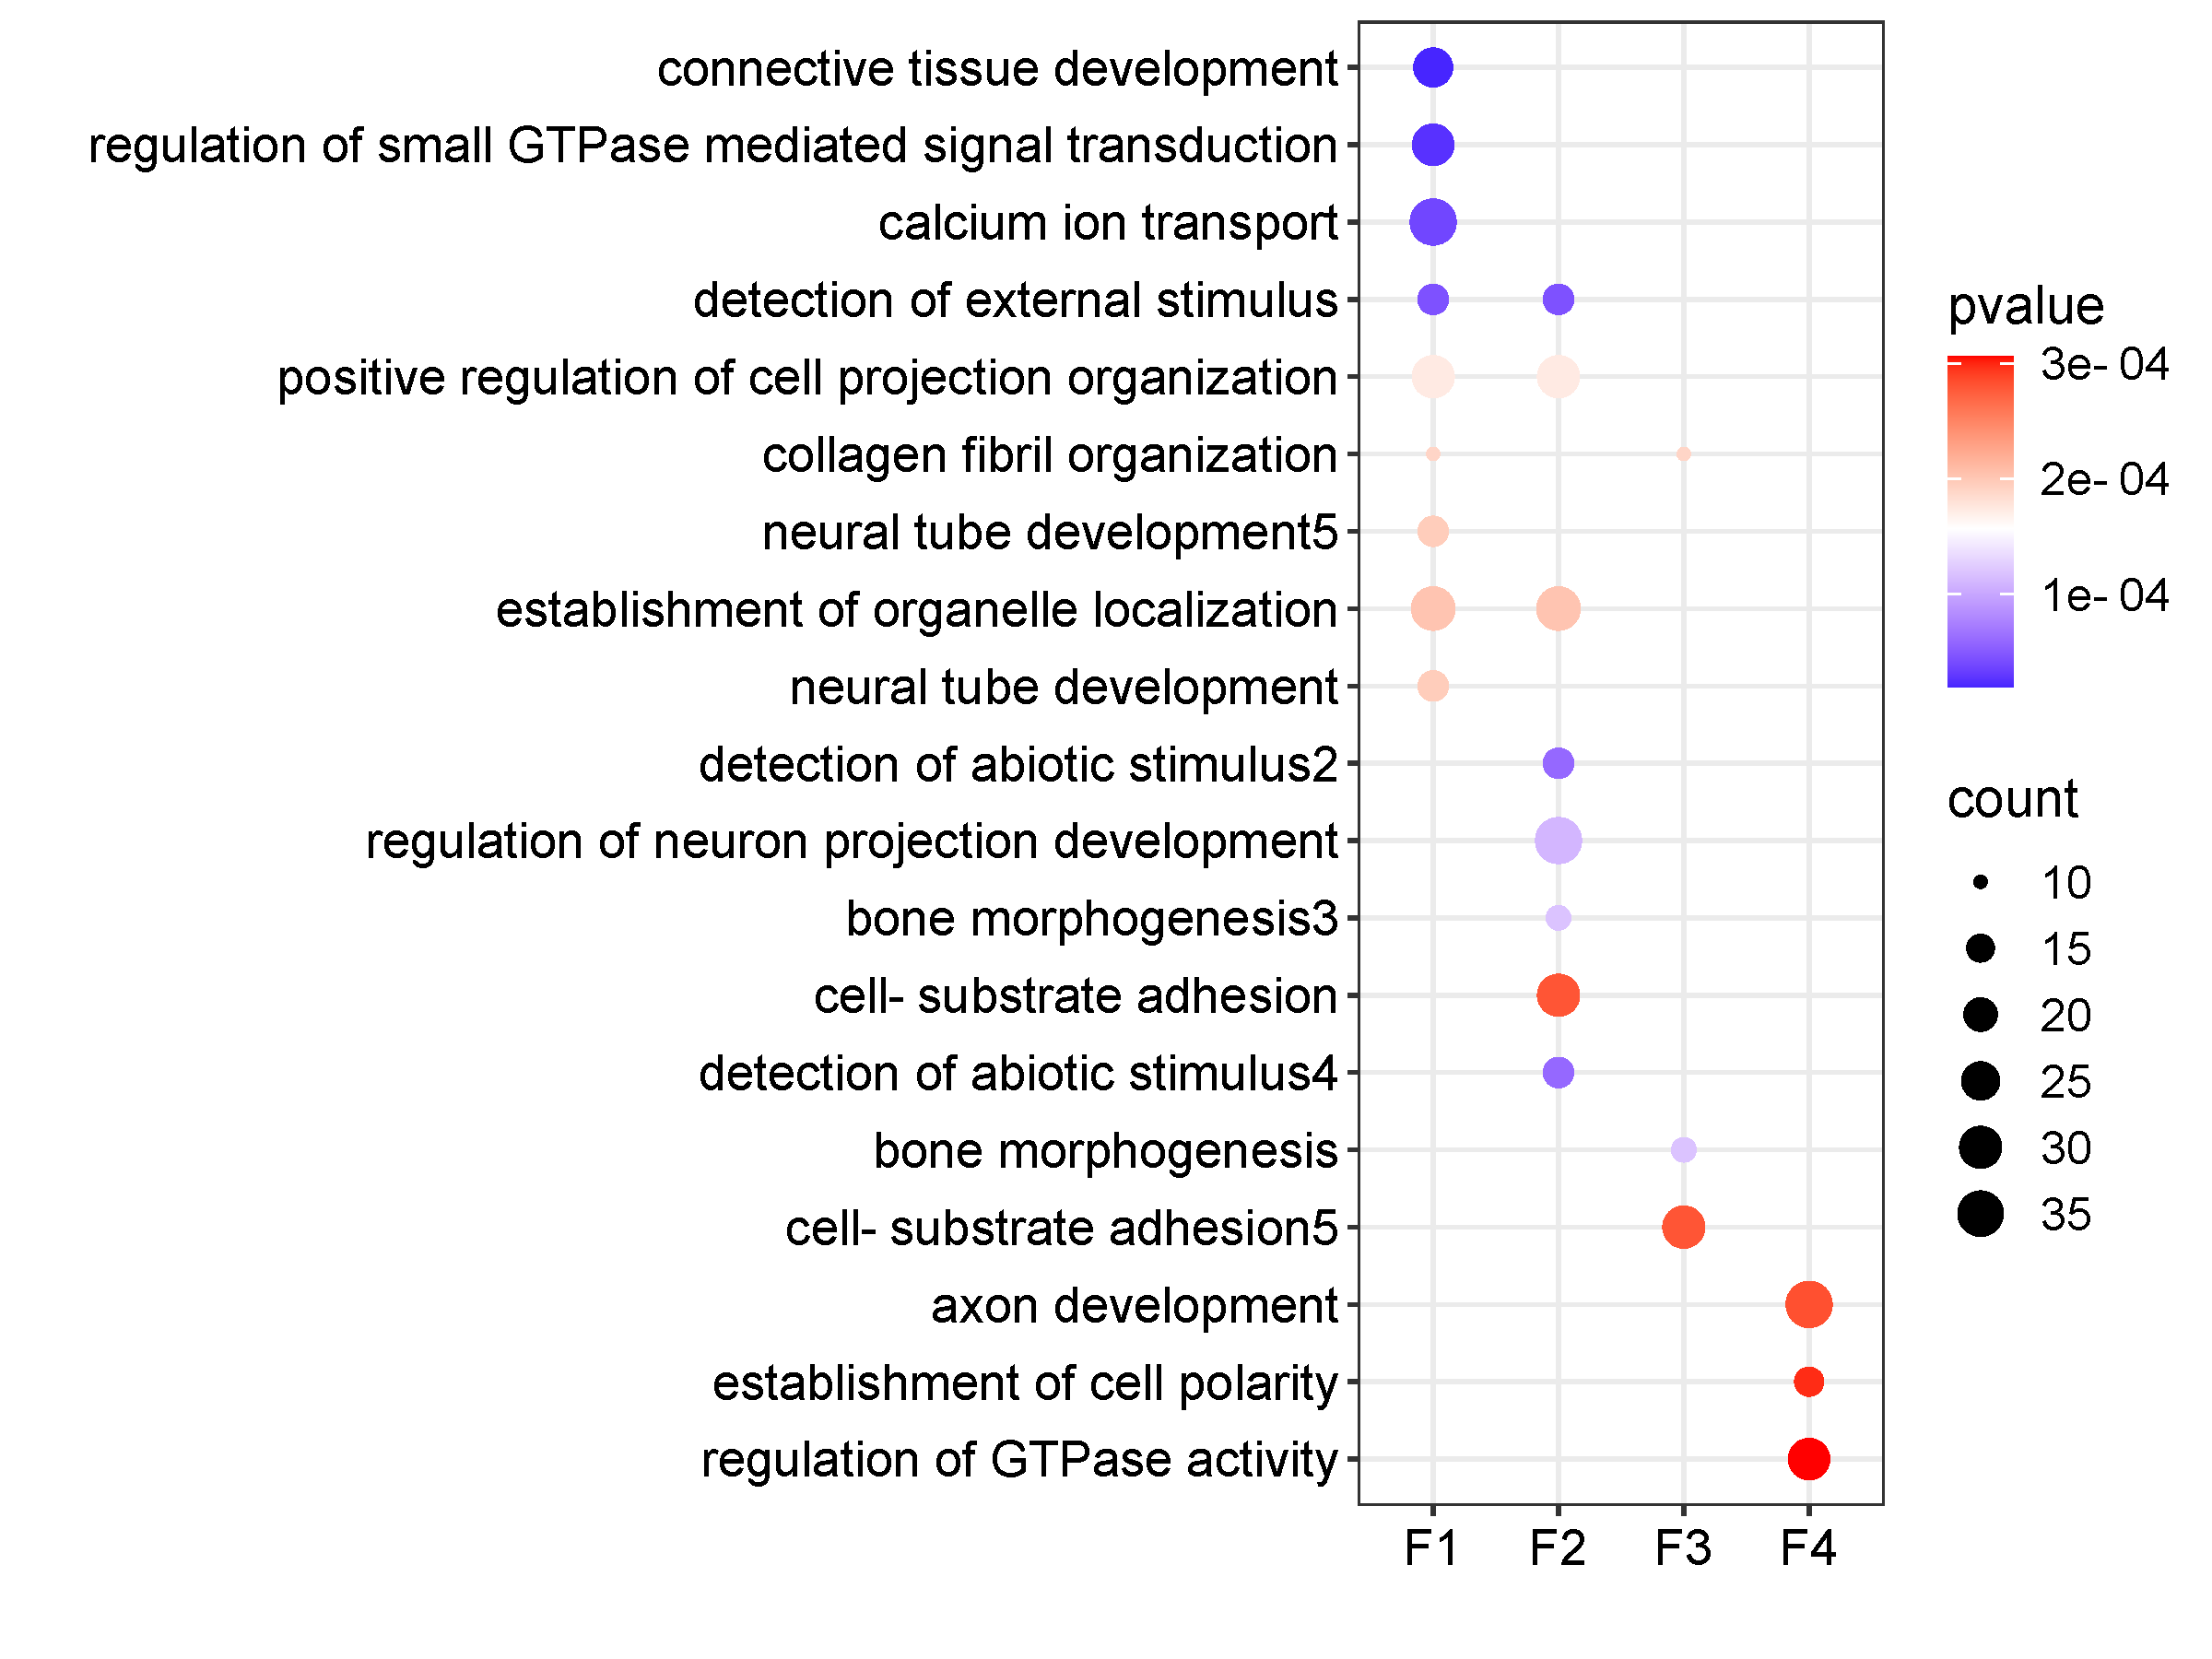
使用点阵形式展示两维数据,点大小代表一个维度,点颜色代表另一个维度。
数据说明
输入数据为4列。第一列是X轴(例如不同比较),第二列是Y轴(例如pathway),第3列描述点的大小(例如基因数),第4列描述点的颜色(例如p值)
论文例子
Cardiac and Skeletal Muscle Transcriptome Response to Heat Stress in Kenyan Chicken Ecotypes Adapted to Low and High Altitudes Reveal Differences in Thermal Tolerance and Stress Response. Fig4
如何引用?
建议直接写网址。助力10000+篇
(google学术),9000+篇
(知网)论文
正式引用:Tang D, Chen M, Huang X, Zhang G, Zeng L, Zhang G, Wu S, Wang Y.
SRplot: A free online platform for data visualization and graphing. PLoS One. 2023 Nov 9;18(11):e0294236. doi: 10.1371/journal.pone.0294236. PMID: 37943830.
方法章节:Heatmap was plotted by https://www.bioinformatics.com.cn (last accessed on May 4, 2026), an online platform for data analysis and visualization.
致谢章节:We thank Mingjie Chen (Shanghai NewCore Biotechnology Co., Ltd.) for providing data analysis and visualization support.