桑基气泡图(sankey + dot plot)
简介
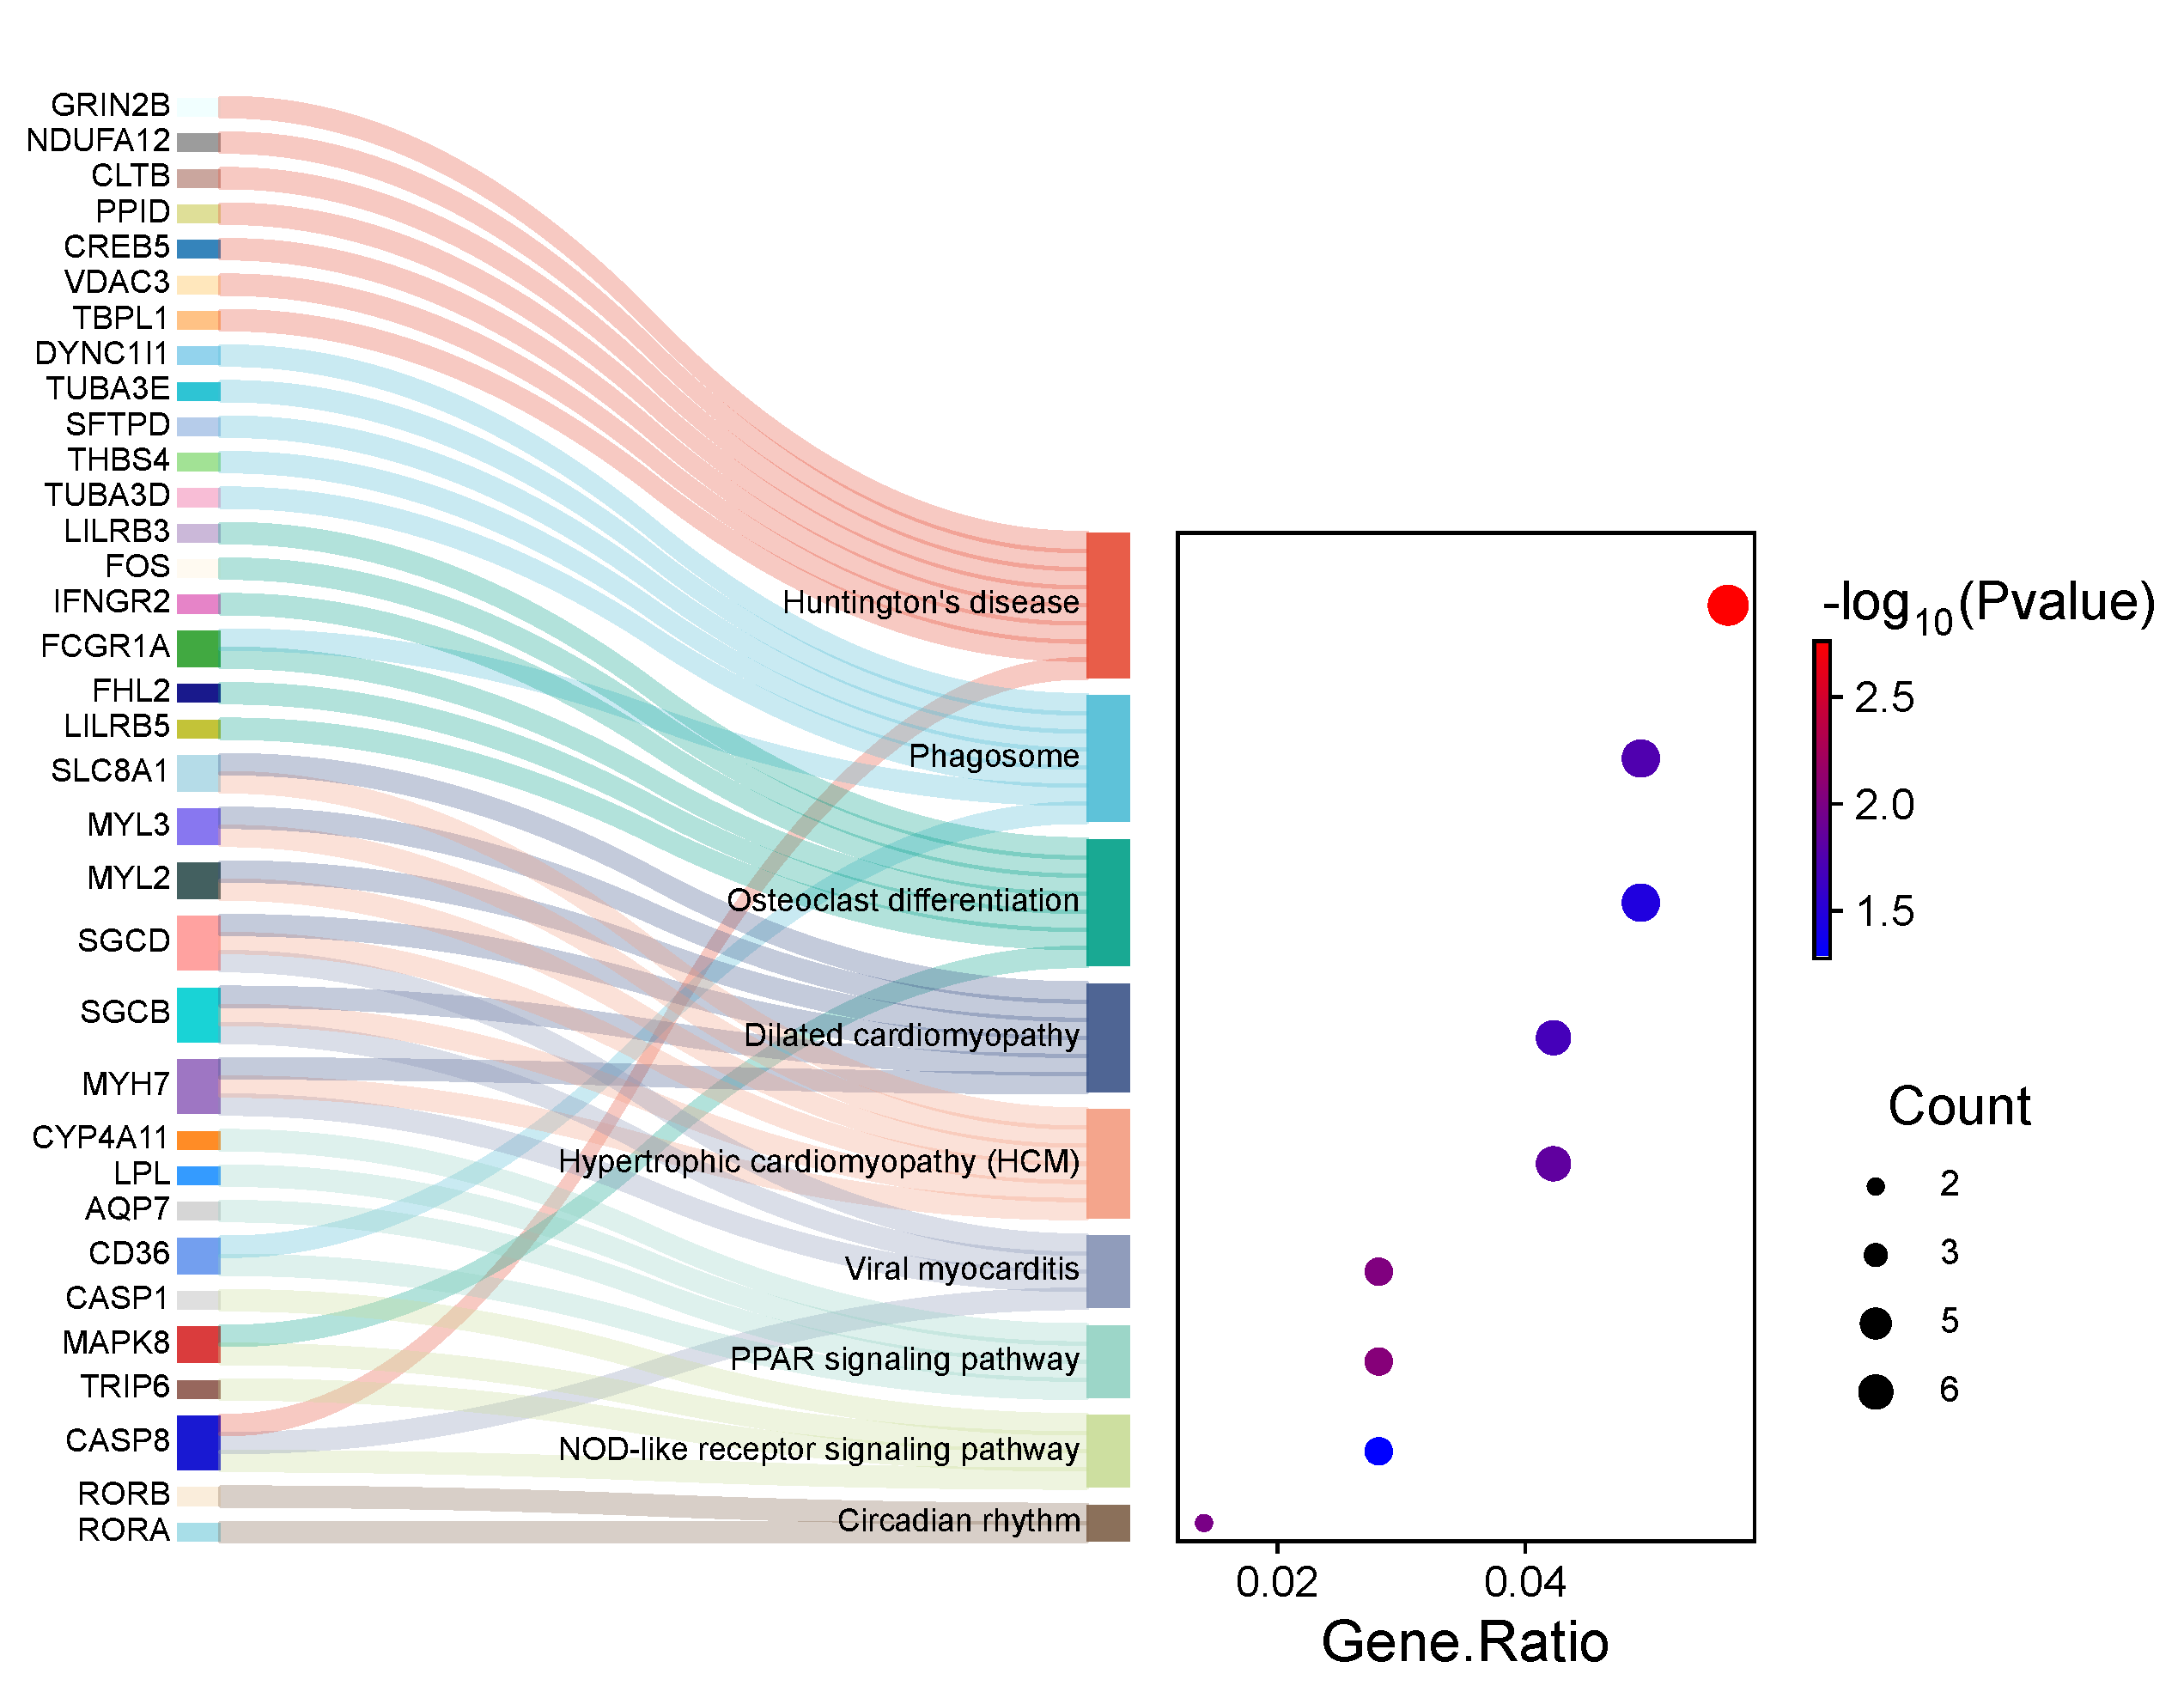
该图左侧为
桑基图(sankey),代表每个
pathway中包含的基因,右侧为常规的气泡图,气泡大小表示pathway所属的基因个数,气泡颜色表示p值
数据说明
数据必需为5列,第一列为pathway名字,第二列为gene ratio(必需是数值,不能是4/20这种),第三列为p值(或者fdr等),第四列为基因(必需以/分割),第5列为基因count。内置了200种颜色,所以基因总数或者pathway总数不能超过200个
论文例子
Network-based identification of key master regulators associated with an immune-silent cancer phenotype. fig 7.
如何引用?
建议直接写网址。助力10000+篇
(google学术),9000+篇
(知网)论文
正式引用:Tang D, Chen M, Huang X, Zhang G, Zeng L, Zhang G, Wu S, Wang Y.
SRplot: A free online platform for data visualization and graphing. PLoS One. 2023 Nov 9;18(11):e0294236. doi: 10.1371/journal.pone.0294236. PMID: 37943830.
方法章节:Heatmap was plotted by https://www.bioinformatics.com.cn (last accessed on May 4, 2026), an online platform for data analysis and visualization.
致谢章节:We thank Mingjie Chen (Shanghai NewCore Biotechnology Co., Ltd.) for providing data analysis and visualization support.