富集分析结果彗星图
简介
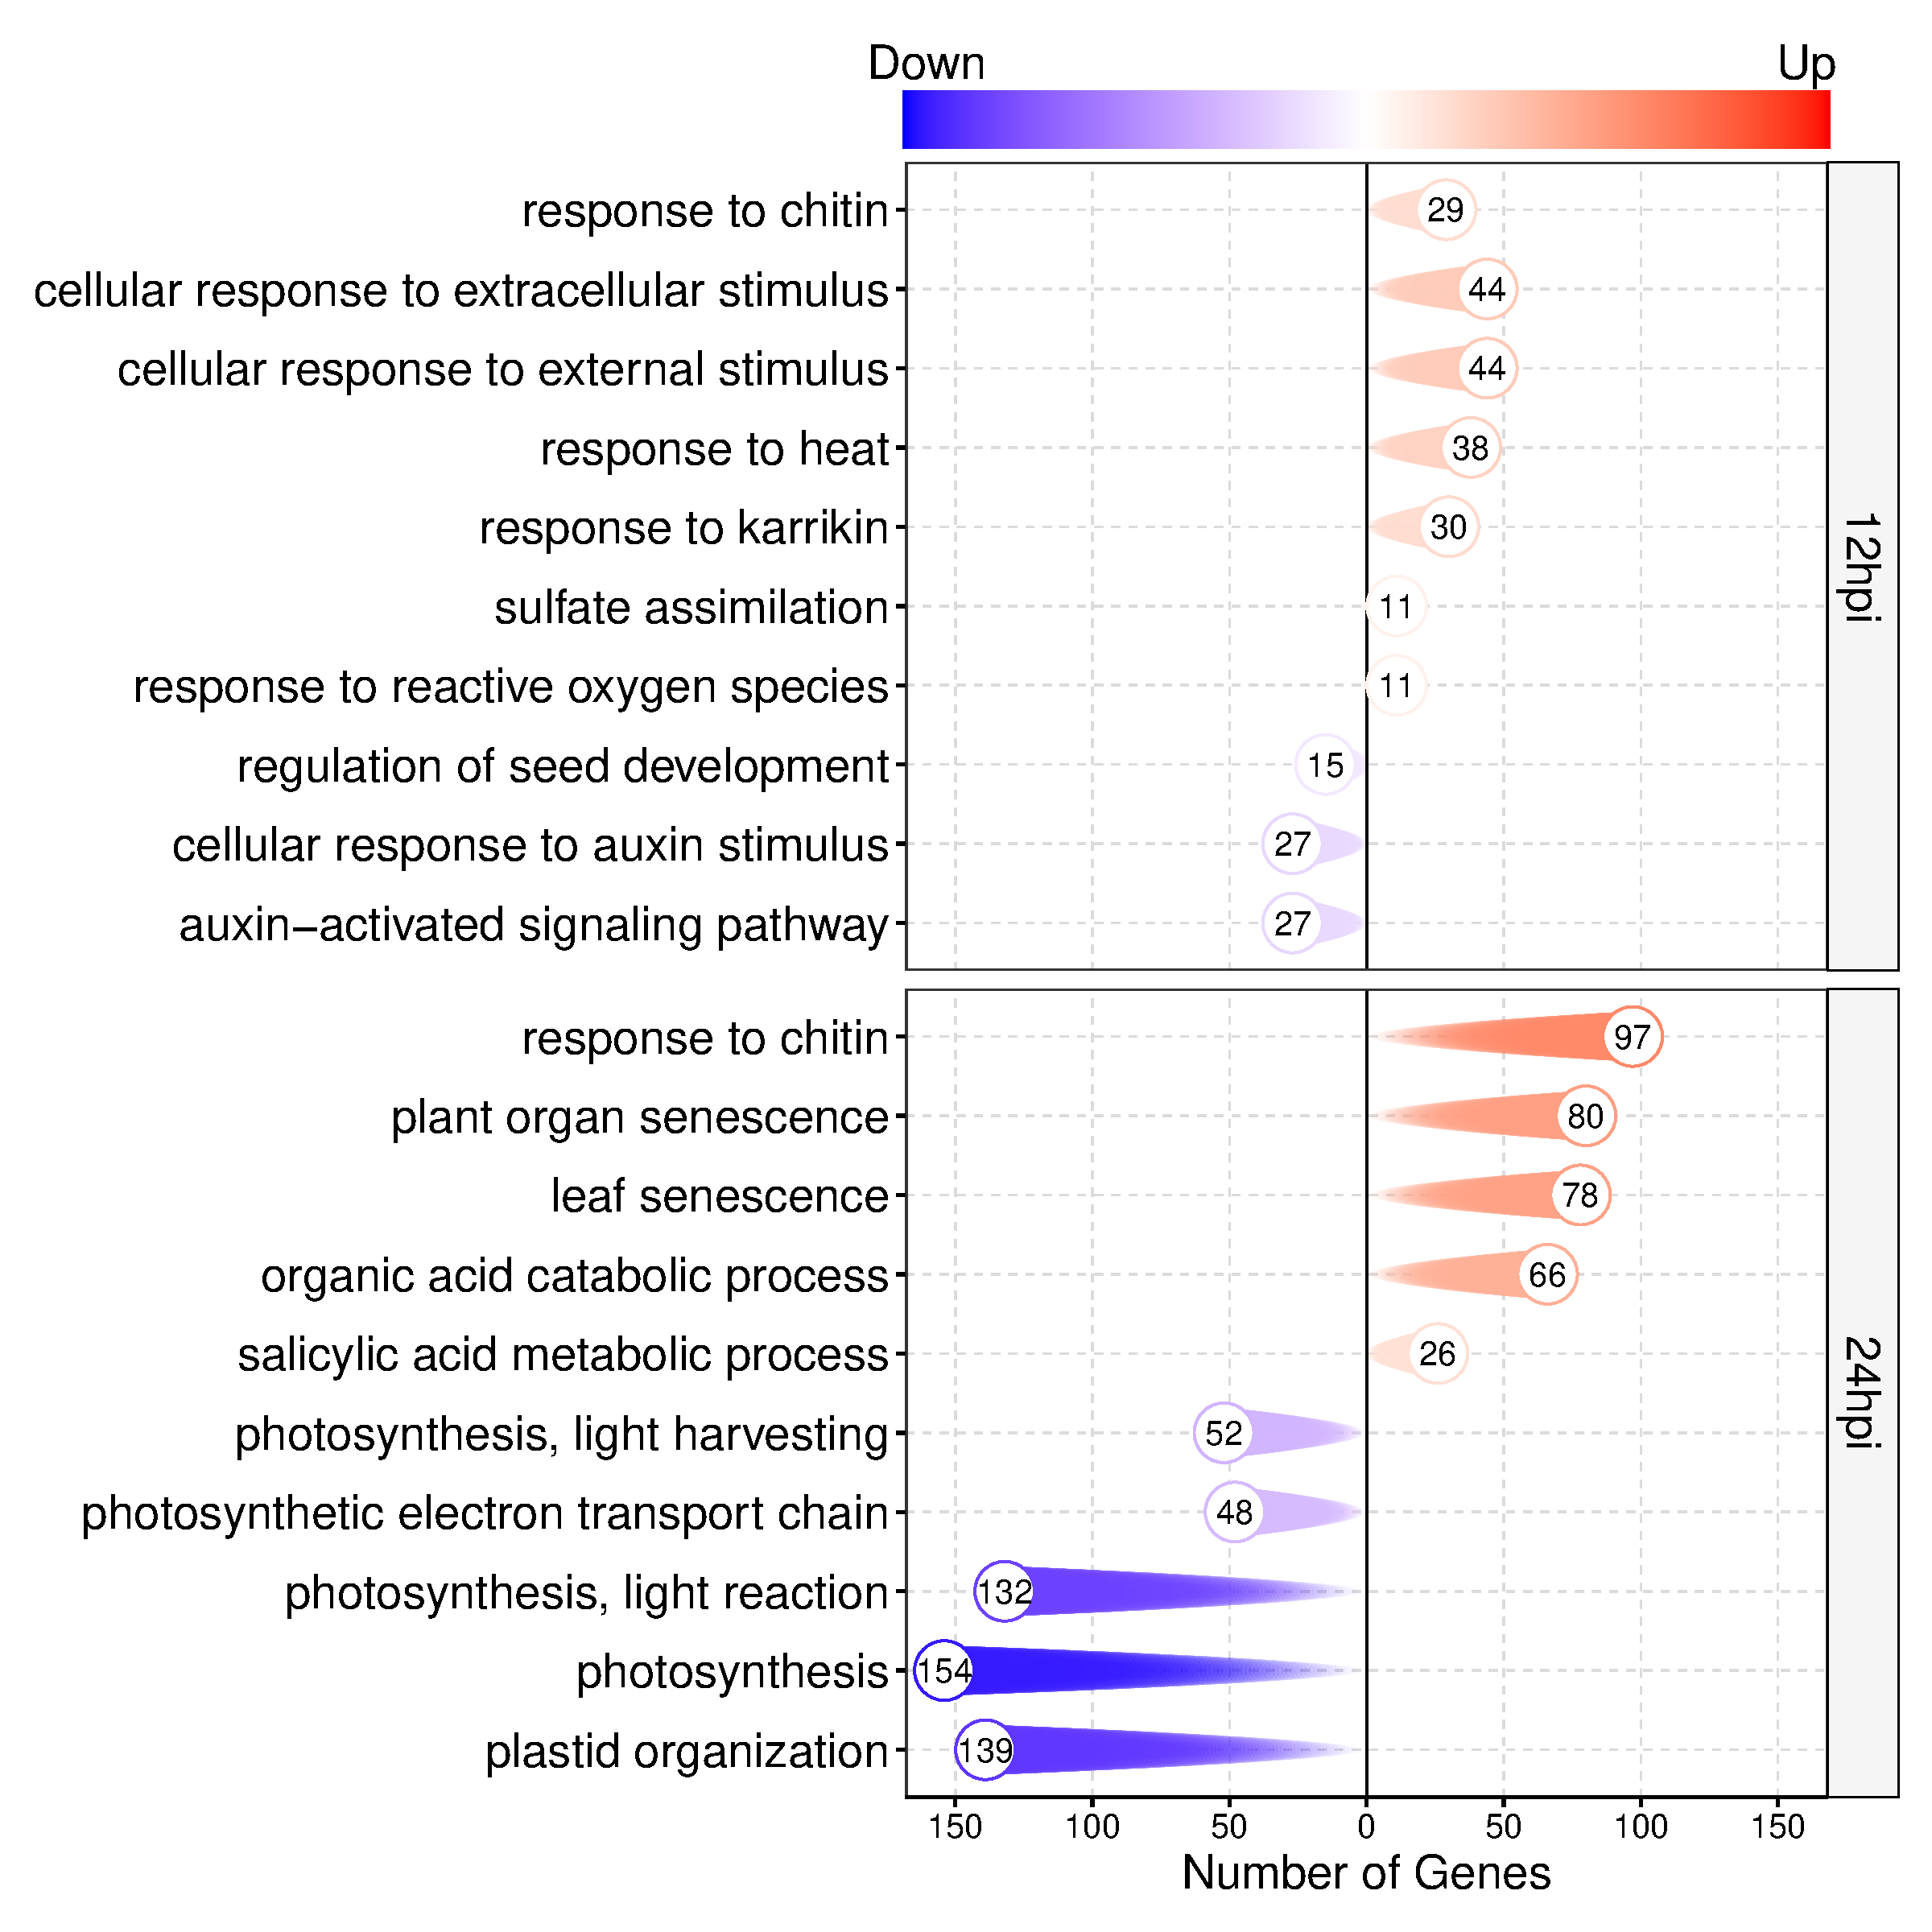
富集分析结果彗星图展示了不同条件下的富集情况,使用彗星(有拖尾的图)展示,尾巴部分使用圆圈加数字展示基因数。
数据说明
输入为5列:第1列是term名;第2列是分组(支持一组和多组);第3列是count数,也就是你输入的基因跟该条目中基因的交集基因数;第4列是方向,down或者up(必须是down或者up,大小写敏感)。注意:这里不考虑p值
论文例子
Time-series transcriptome and metabolome profiling Uncovers WRKY6 and WRKY23 as critical regulators in tobacco response to Pseudomonas syringae infection. fig
论文写作
GO enrichment analysis for DEGs at 12 hpi, 24 hpi, and 60 hpi showing enriched biological process terms for upregulated and downregulated genes at each time point.
如何引用?
建议直接写网址。助力10000+篇
(google学术),9000+篇
(知网)论文
正式引用:Tang D, Chen M, Huang X, Zhang G, Zeng L, Zhang G, Wu S, Wang Y.
SRplot: A free online platform for data visualization and graphing. PLoS One. 2023 Nov 9;18(11):e0294236. doi: 10.1371/journal.pone.0294236. PMID: 37943830.
方法章节:Heatmap was plotted by https://www.bioinformatics.com.cn (last accessed on May 4, 2026), an online platform for data analysis and visualization.
致谢章节:We thank Mingjie Chen (Shanghai NewCore Biotechnology Co., Ltd.) for providing data analysis and visualization support.