堆叠面积图(area stack)
简介
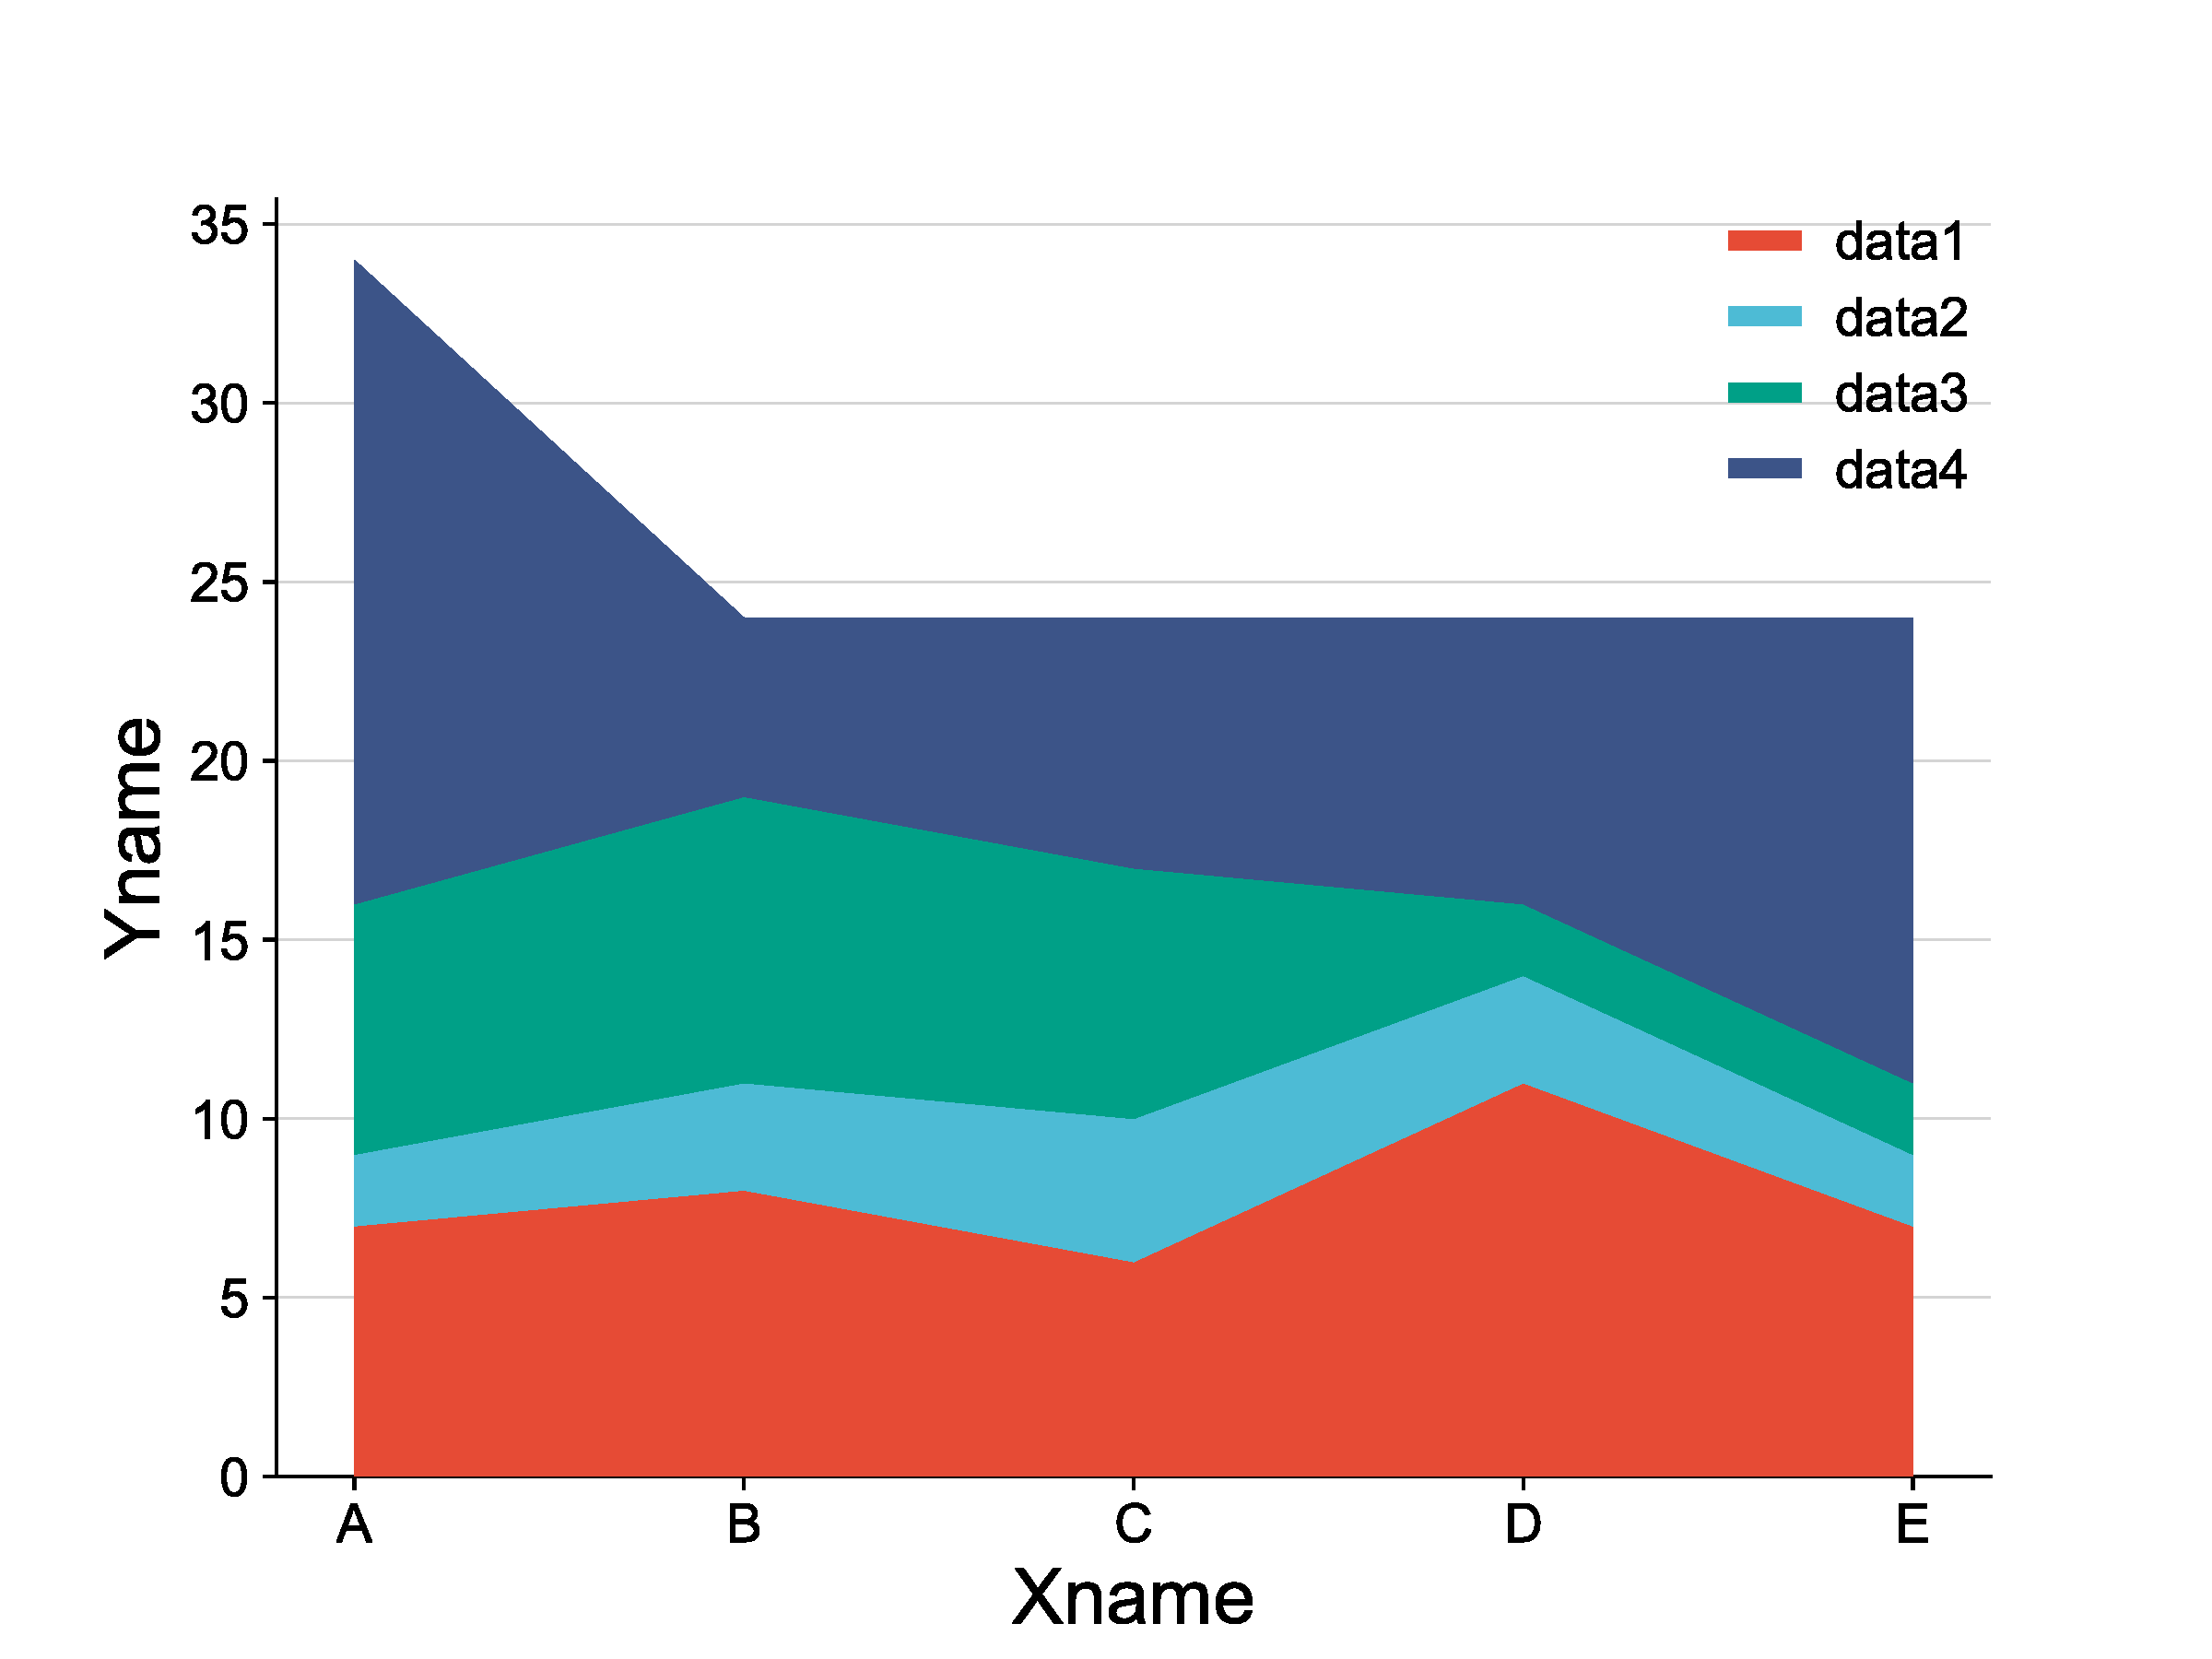
Area Stack,也称为堆叠面积图,用于展示不同类别的数据在相同时间或空间上的变化趋势。这种图表通过将每个类别的面积堆叠在一起,来展示它们随时间或空间的累积效果。
特点:
1)多维度展示:可以同时展示多个数据系列。
2)累积效果:每个数据系列的面积是基于前一个系列的累积值计算的。
3)时间序列:通常用于展示随时间变化的数据。
4)比较:可以直观地比较不同类别的相对大小和变化趋势。
数据说明
输入为数据矩阵。列对应X轴,行对应Y轴。
论文例子
Epidemiological features and temporal trends of HIV- negative tuberculosis burden from 1990 to 2019: a retrospective analysis based on the Global Burden of Disease Study 2019 fig 4A
| 输入 |
xticks	A	B	C	D	E
data1	7	8	6	11	7
data2	2	3	4	3	2
data3	7	8	7	2	2
data4 18 5 7 8 13 |
| 输出 |
|
如何引用?
建议直接写网址。助力10000+篇
(google学术),9000+篇
(知网)论文
正式引用:Tang D, Chen M, Huang X, Zhang G, Zeng L, Zhang G, Wu S, Wang Y.
SRplot: A free online platform for data visualization and graphing. PLoS One. 2023 Nov 9;18(11):e0294236. doi: 10.1371/journal.pone.0294236. PMID: 37943830.
方法章节:Heatmap was plotted by https://www.bioinformatics.com.cn (last accessed on May 4, 2026), an online platform for data analysis and visualization.
致谢章节:We thank Mingjie Chen (Shanghai NewCore Biotechnology Co., Ltd.) for providing data analysis and visualization support.
