带连线路径的堆叠柱状图
简介
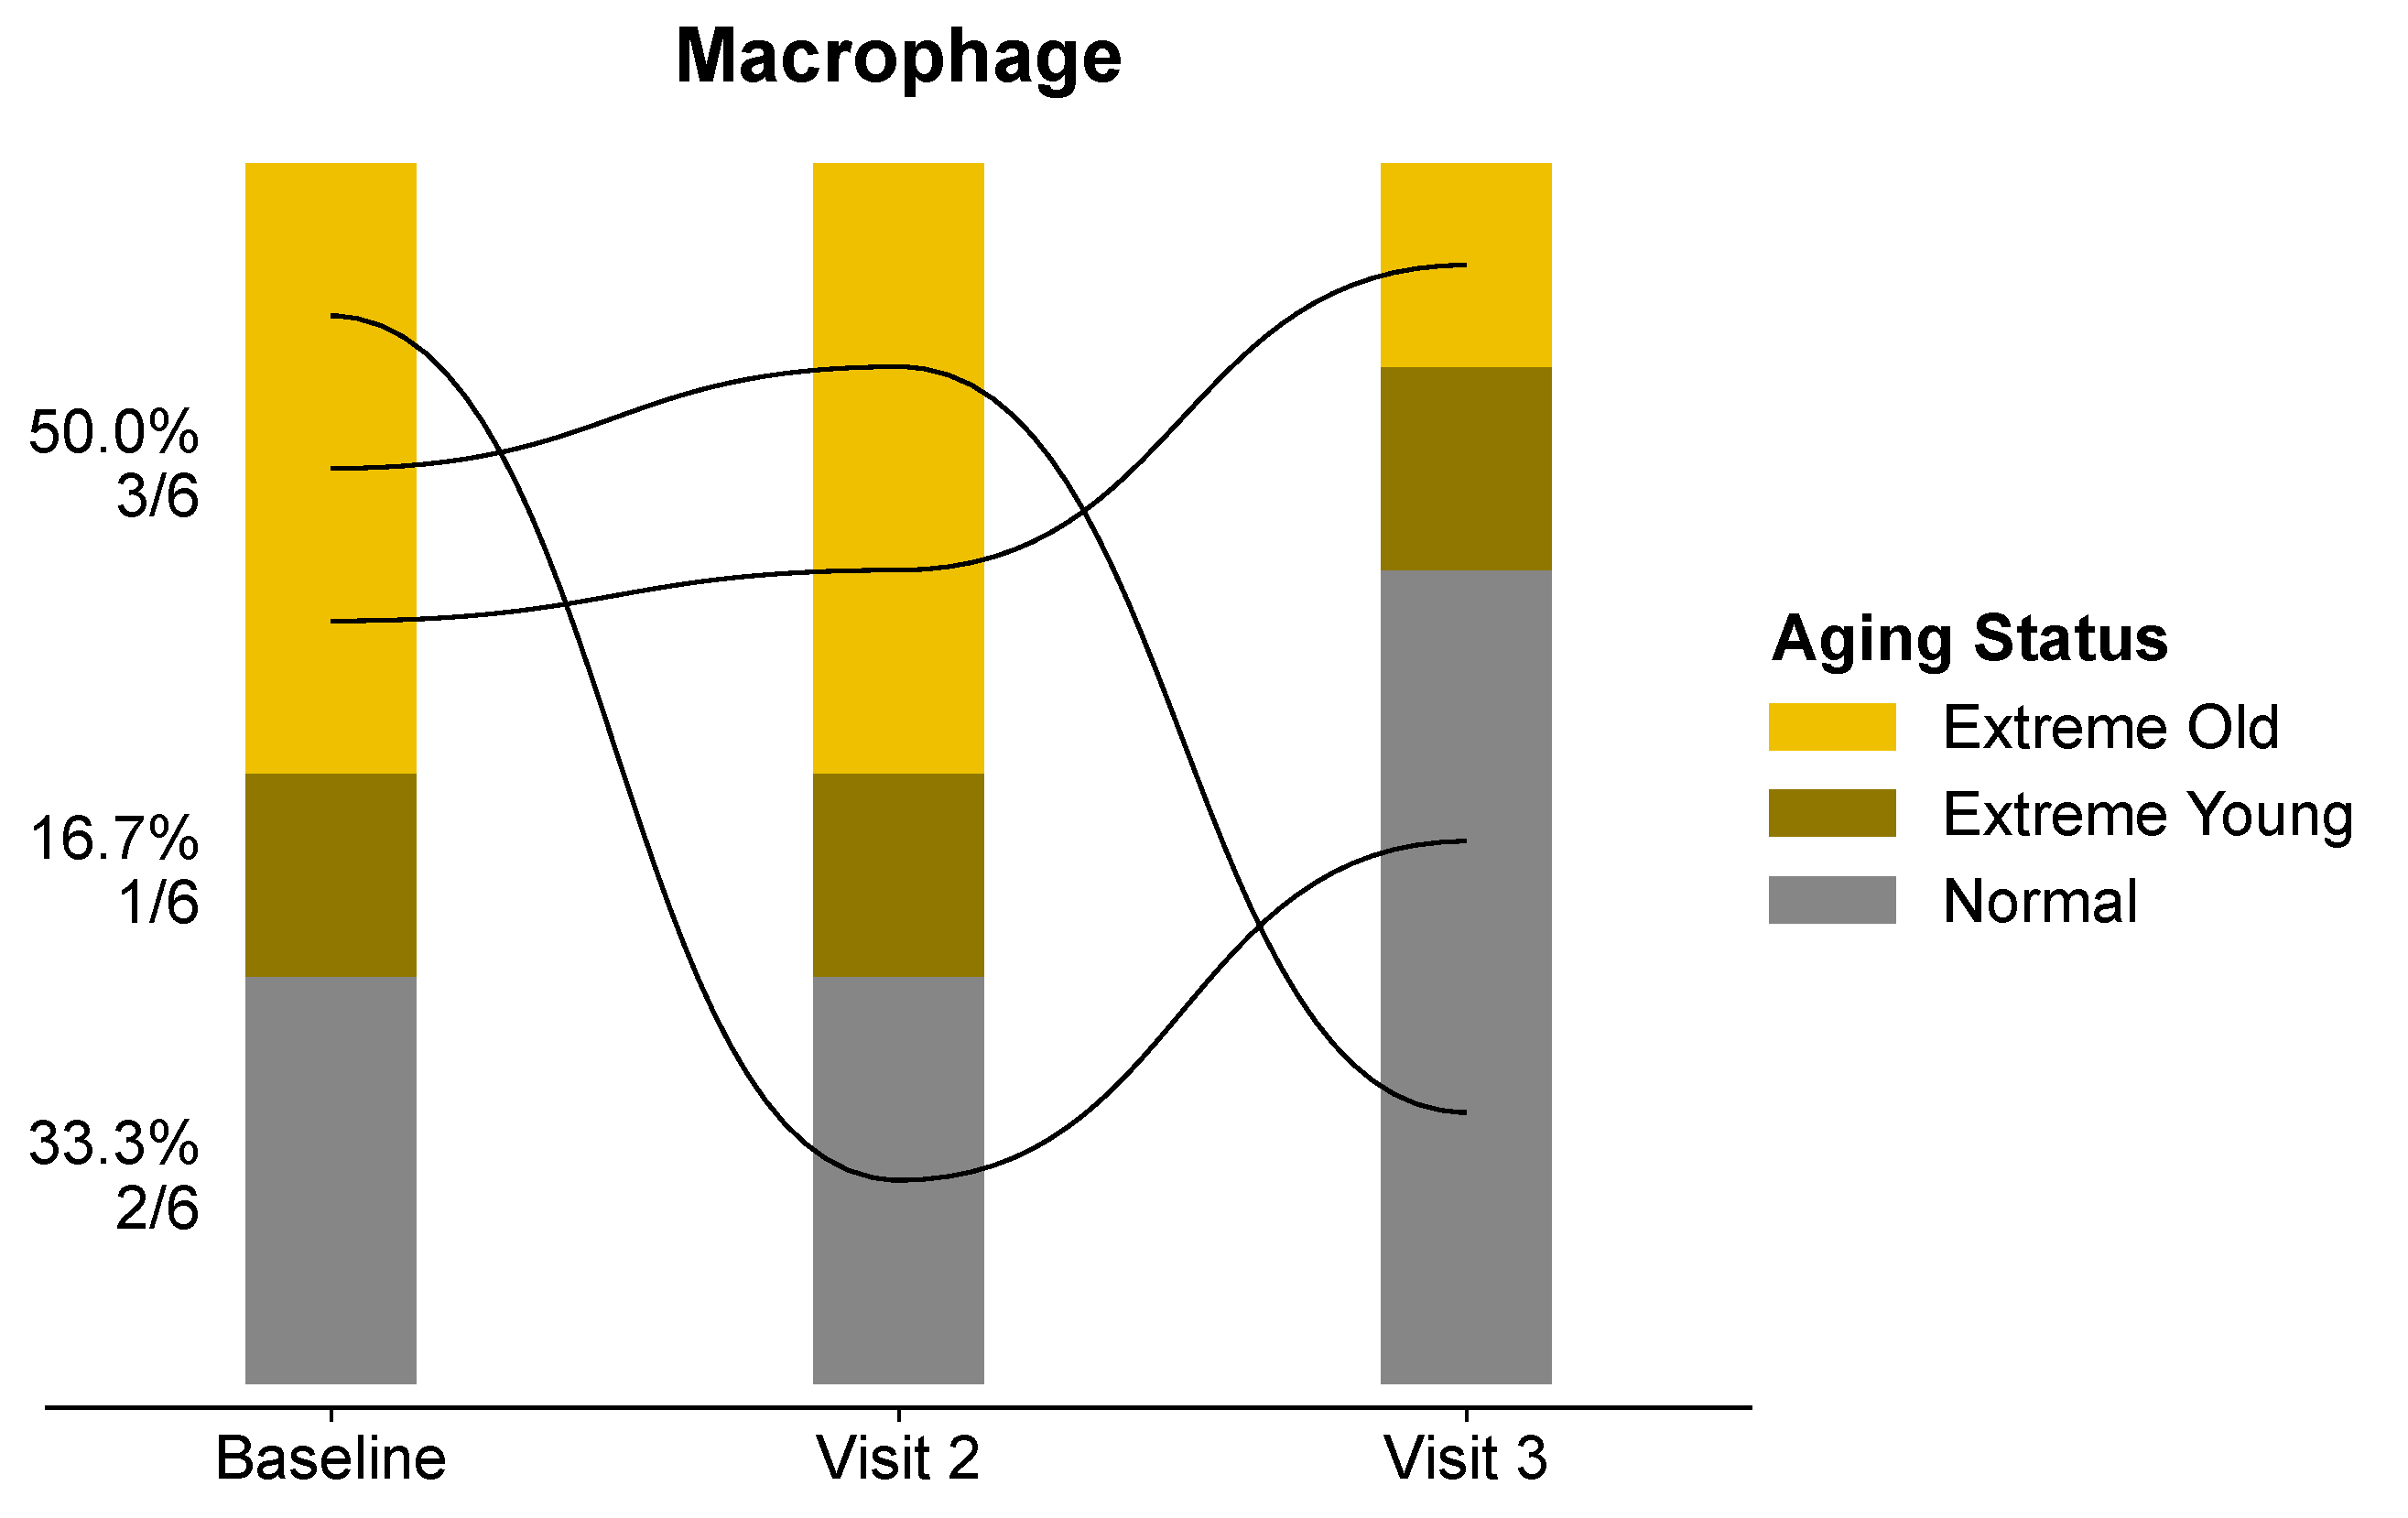
根据患者的类别绘制堆叠bar图,然后挑选感兴趣的患者以连线的形式将患者在不同时间点的类别相连。既可以看出不同时间点的患者分布情况,又可以看到感兴趣患者的状态变化。是桑基图的变体。
输入数据
数据包含3+列:第1列是患者id(必须唯一);后续列是不同时间点的患者分布情况。这里使用的是类别,不是数值。
论文例子
Cellular Aging Signatures in the Plasma Proteome Record Human Health and Disease Fig 2e.
如何引用?
建议直接写网址。助力10000+篇
(google学术),9000+篇
(知网)论文
正式引用:Tang D, Chen M, Huang X, Zhang G, Zeng L, Zhang G, Wu S, Wang Y.
SRplot: A free online platform for data visualization and graphing. PLoS One. 2023 Nov 9;18(11):e0294236. doi: 10.1371/journal.pone.0294236. PMID: 37943830.
方法章节:Heatmap was plotted by https://www.bioinformatics.com.cn (last accessed on May 4, 2026), an online platform for data analysis and visualization.
致谢章节:We thank Mingjie Chen (Shanghai NewCore Biotechnology Co., Ltd.) for providing data analysis and visualization support.