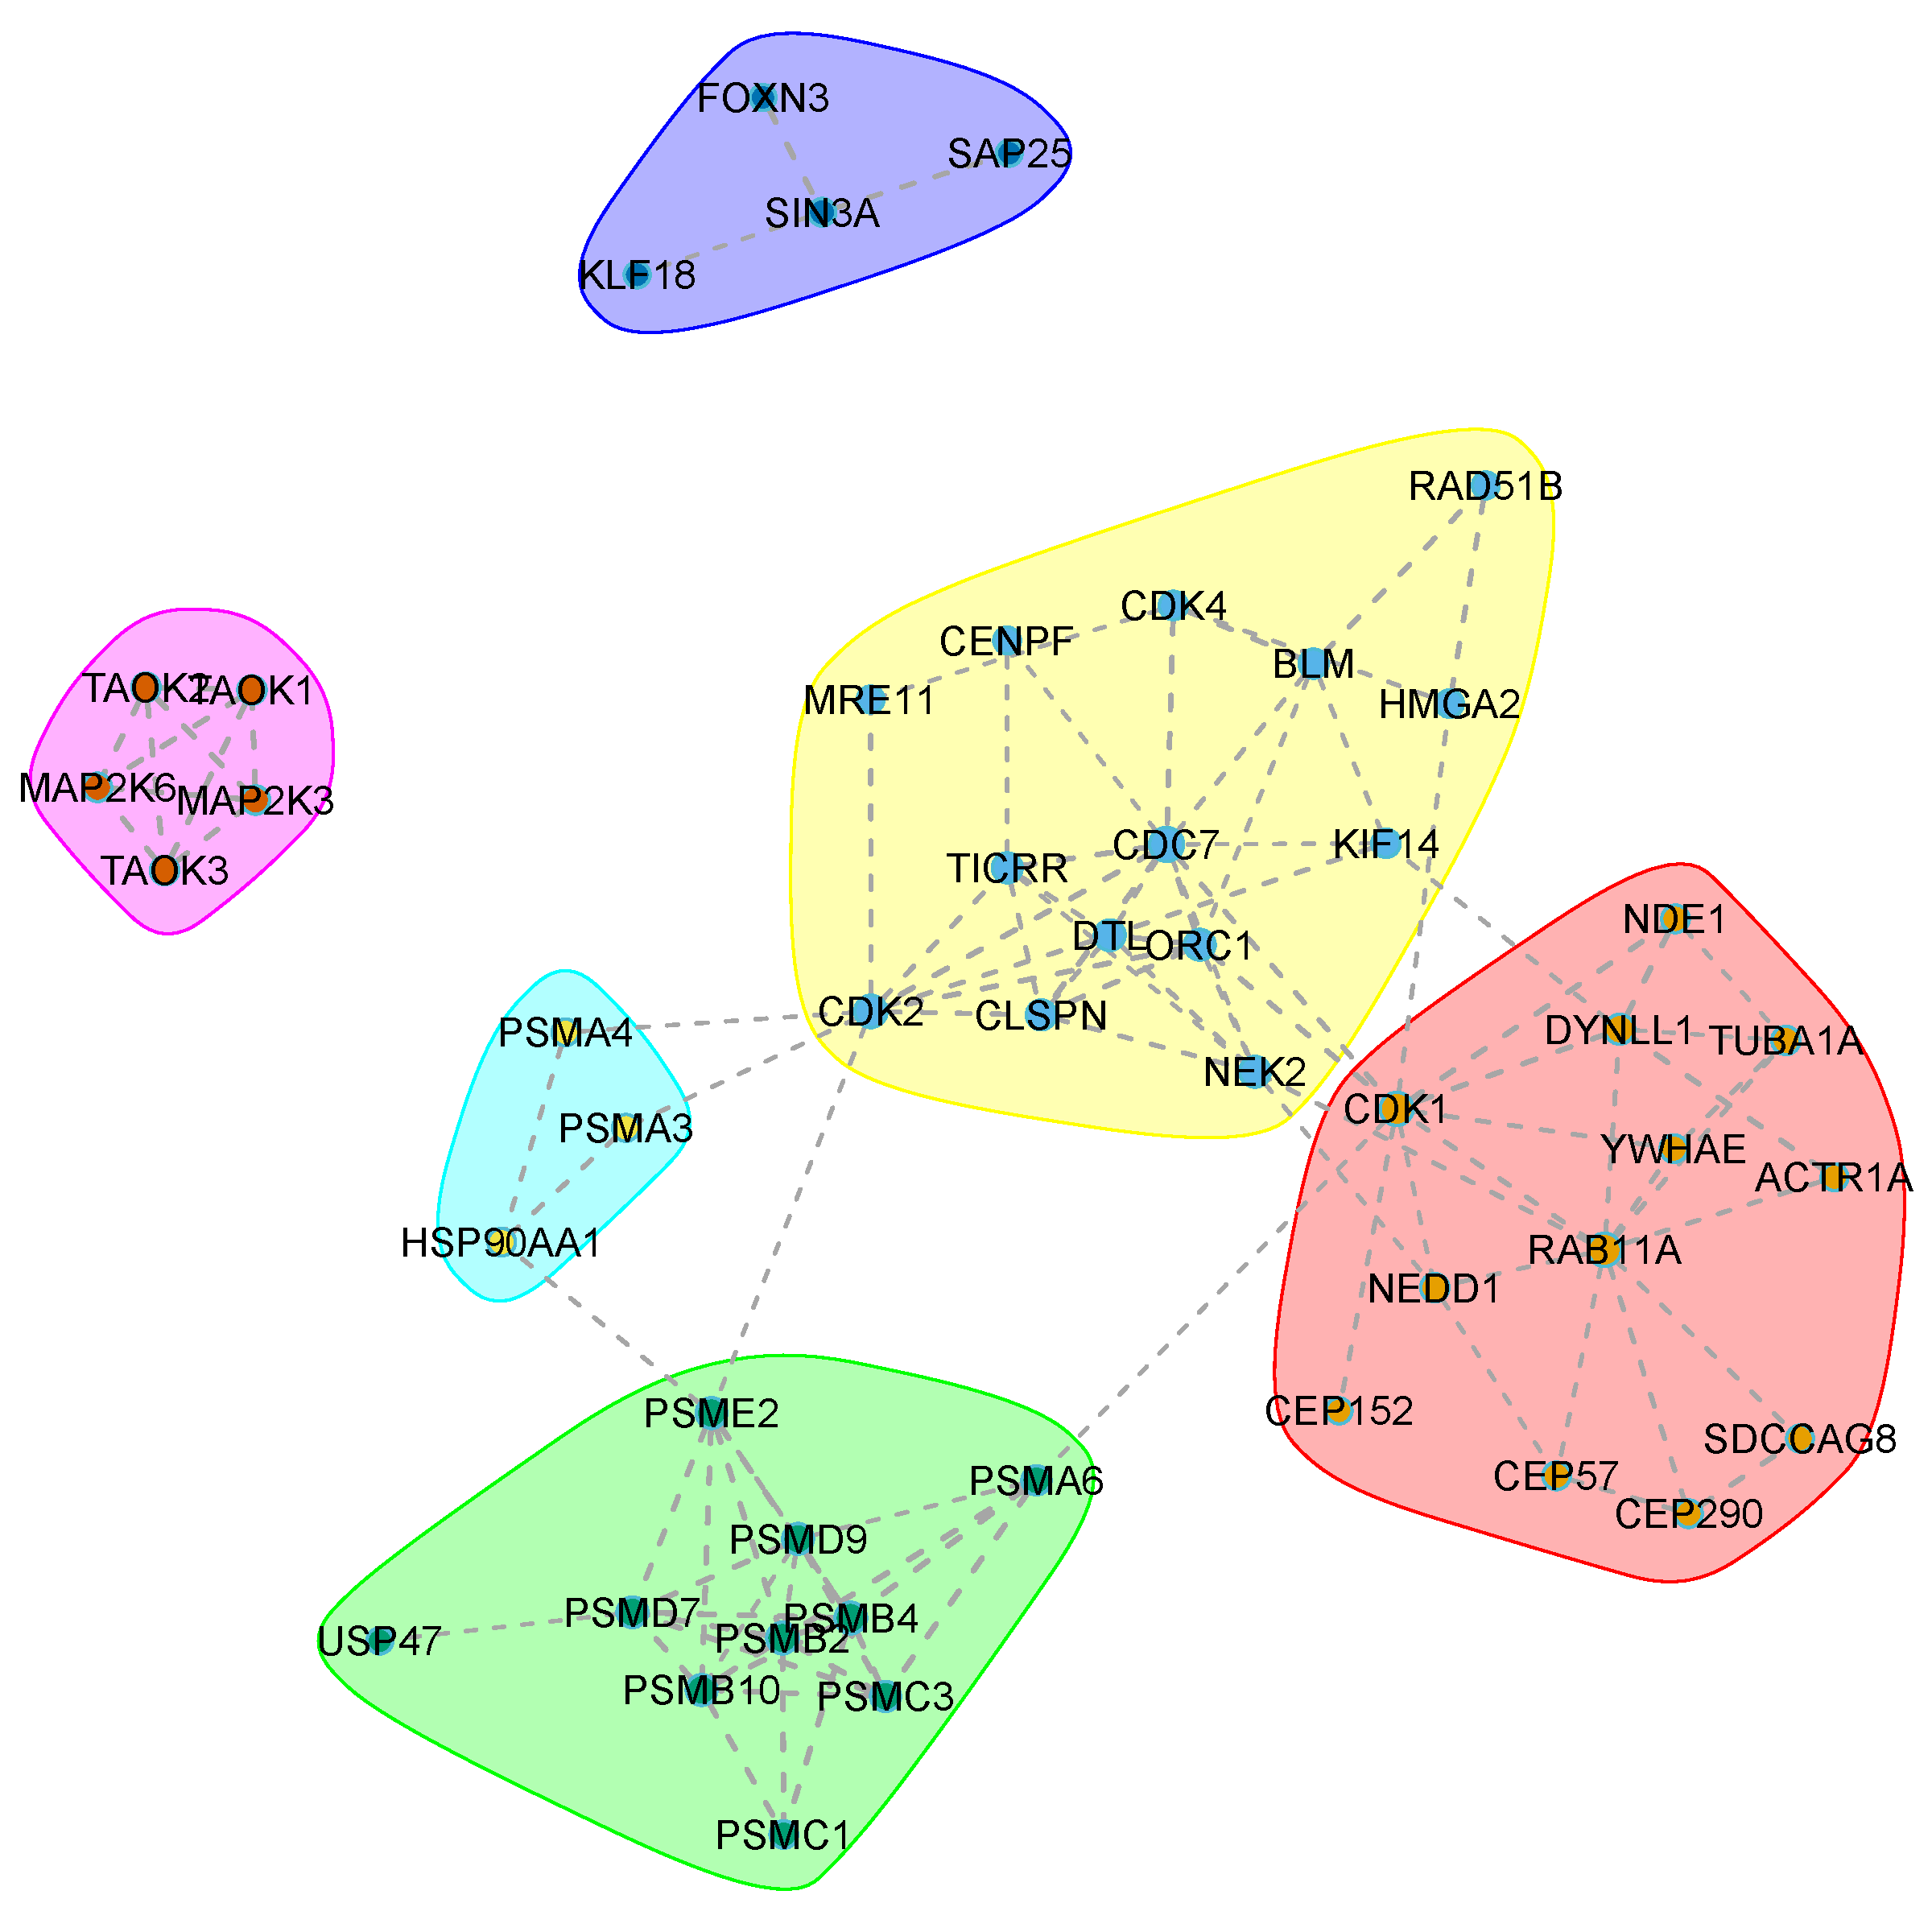
蛋白质-蛋白质相互作用网络图
数据说明
数据为2列:第1列为蛋白质名(source),第2列为蛋白质名(target)
数据为3列:第1列为蛋白质名(source),第2列为蛋白质名(target),第3列为stringdb数据库的score
论文例子
Whole-transcriptome sequencing uncovers core regulatory modules and gene signatures of human fetal growth restriction. Fig4D
如何引用?
建议直接写网址。助力10000+篇
(google学术),9000+篇
(知网)论文
正式引用:Tang D, Chen M, Huang X, Zhang G, Zeng L, Zhang G, Wu S, Wang Y.
SRplot: A free online platform for data visualization and graphing. PLoS One. 2023 Nov 9;18(11):e0294236. doi: 10.1371/journal.pone.0294236. PMID: 37943830.
方法章节:Heatmap was plotted by https://www.bioinformatics.com.cn (last accessed on May 4, 2026), an online platform for data analysis and visualization.
致谢章节:We thank Mingjie Chen (Shanghai NewCore Biotechnology Co., Ltd.) for providing data analysis and visualization support.