染色体位置+统计柱状图
简介
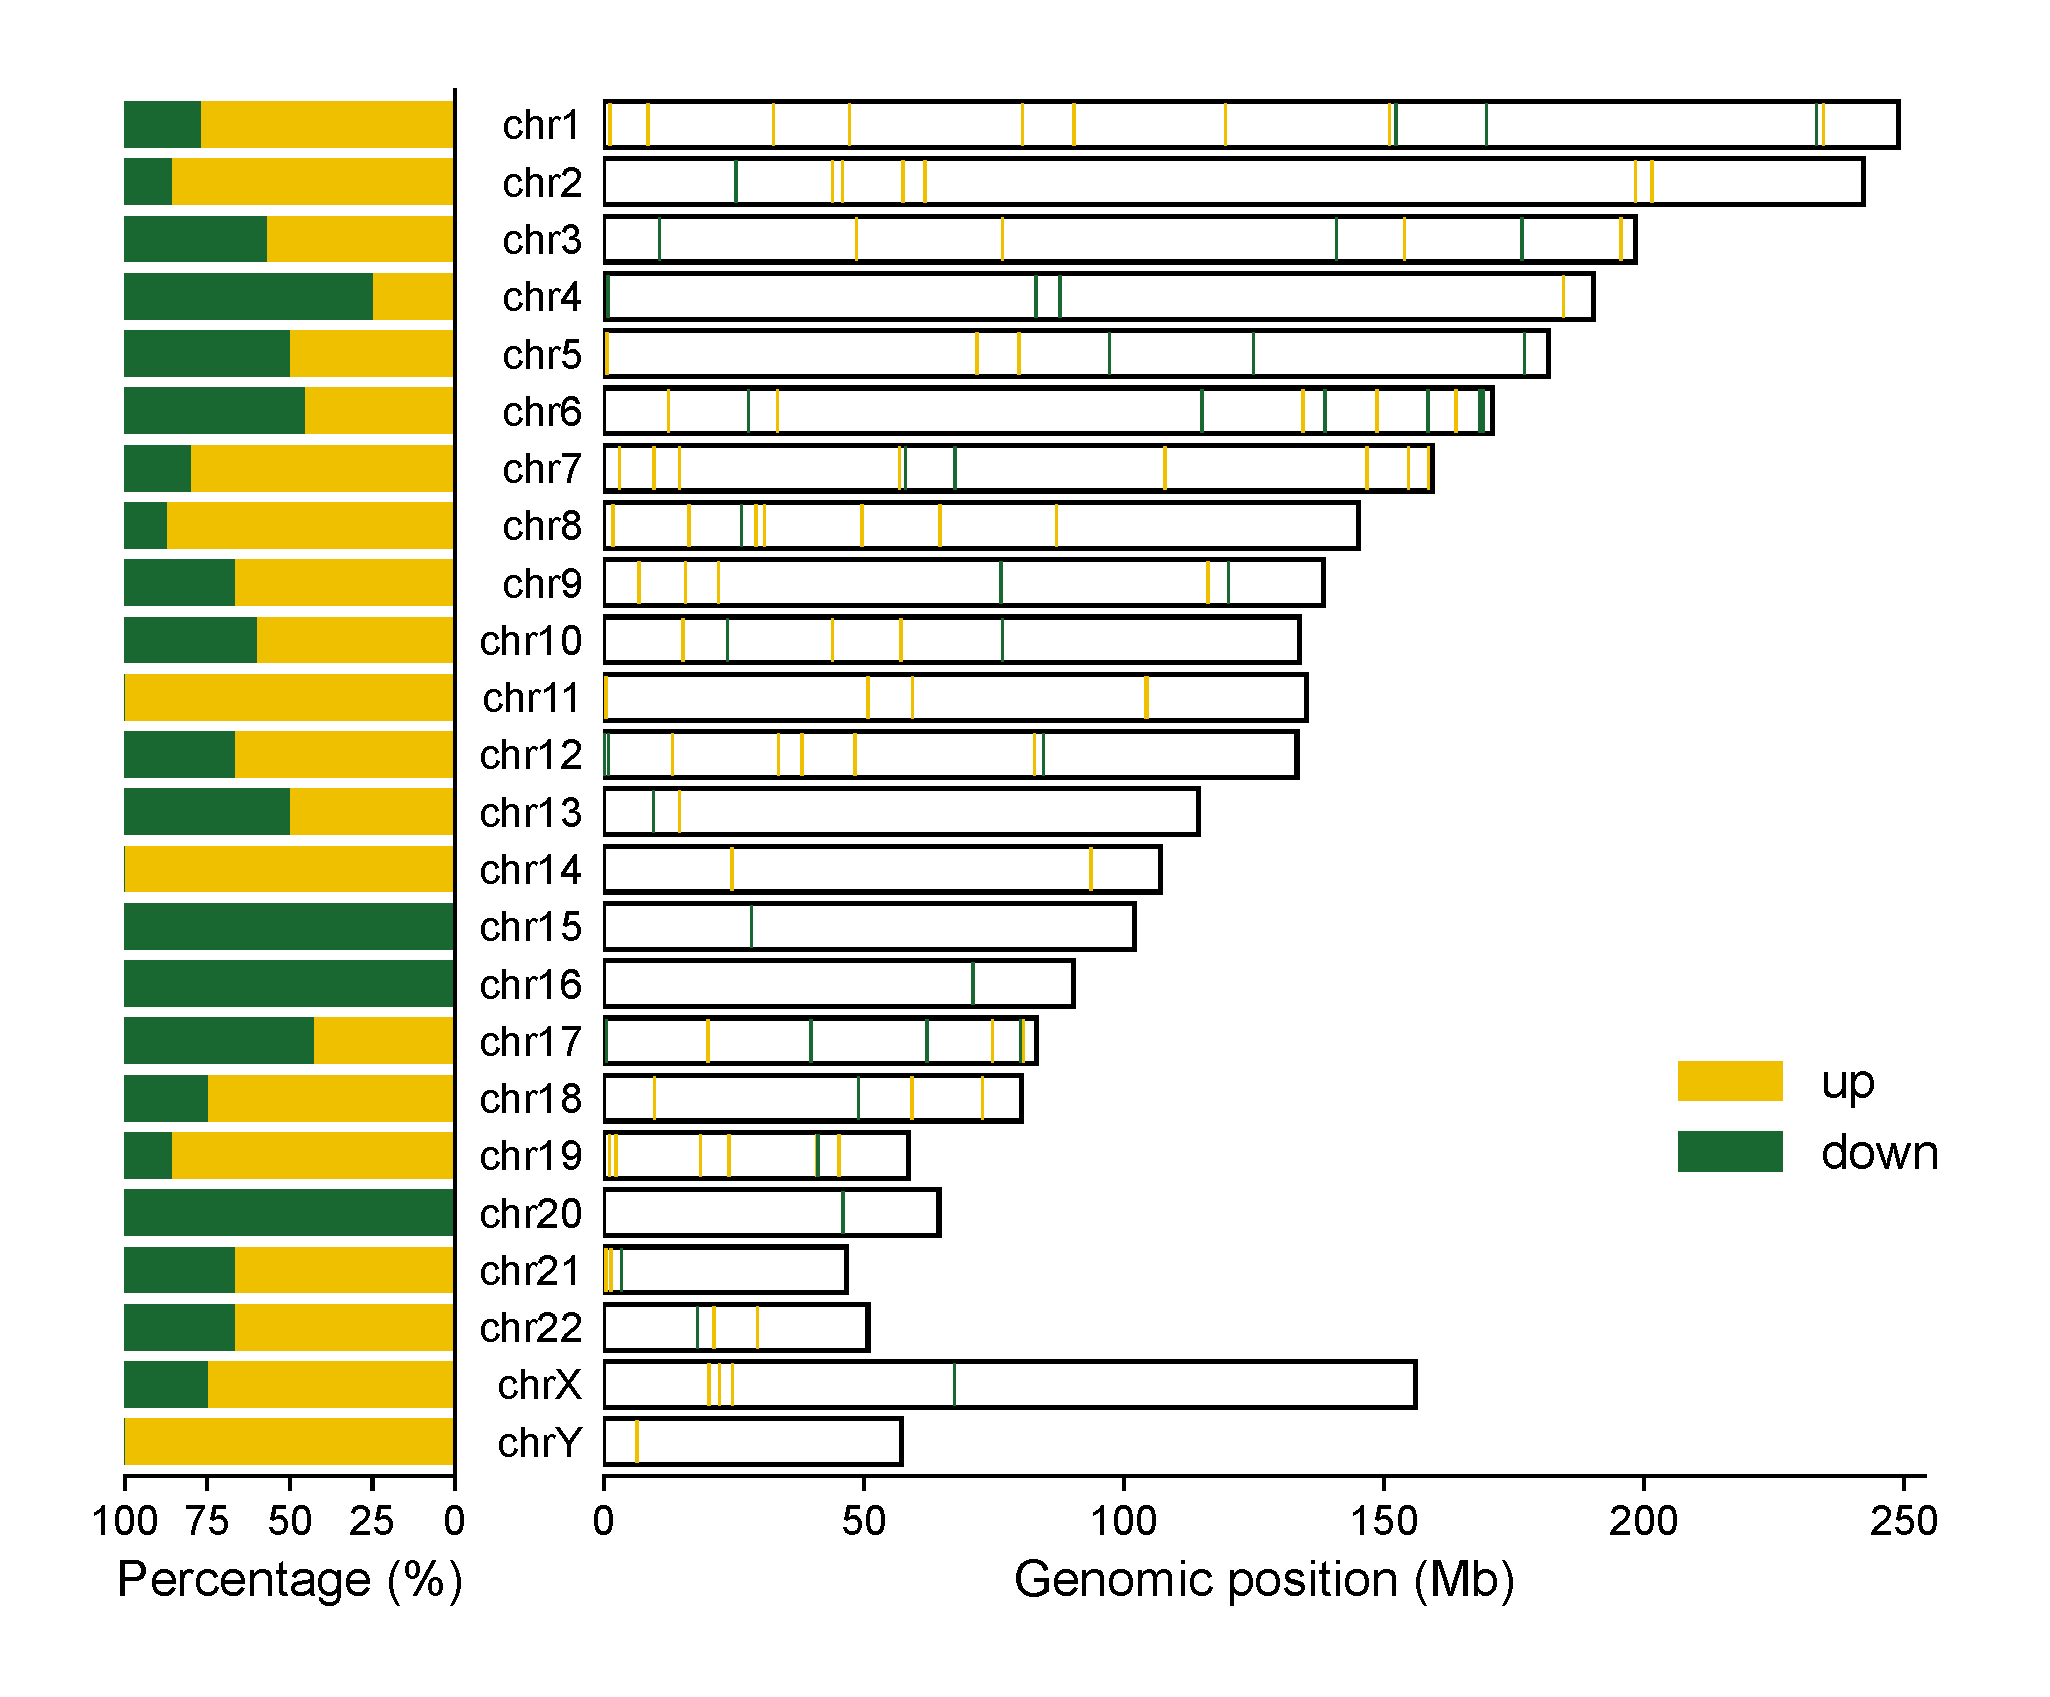
右侧是染色体及每条染色体上差异peak的位置,垂直线表示peak,不同颜色表示不同类别。左侧是每条染色体上不同类别的统计百分比或者计数堆叠图。
输入数据
输入包括两个:第一个是染色体及其长度(两列:染色体名字和染色体长度);第二个是染色体上位置和类型(三列:染色体名字,染色体位置和类别)。
论文例子
Replication timing alterations are associated with mutation acquisition during breast and lung cancer evolution Fig 2a
如何引用?
建议直接写网址。助力10000+篇
(google学术),9000+篇
(知网)论文
正式引用:Tang D, Chen M, Huang X, Zhang G, Zeng L, Zhang G, Wu S, Wang Y.
SRplot: A free online platform for data visualization and graphing. PLoS One. 2023 Nov 9;18(11):e0294236. doi: 10.1371/journal.pone.0294236. PMID: 37943830.
方法章节:Heatmap was plotted by https://www.bioinformatics.com.cn (last accessed on May 4, 2026), an online platform for data analysis and visualization.
致谢章节:We thank Mingjie Chen (Shanghai NewCore Biotechnology Co., Ltd.) for providing data analysis and visualization support.